The world came closer to this scenario than most people realize. On March 4, 2026 — four days after US and Israeli forces launched strikes against Iran — an Iranian Revolutionary Guard commander issued radio warnings prohibiting all navigation through the Strait of Hormuz, warning that any vessel attempting transit would be targeted. Within a week, tanker traffic through the strait had fallen by 90%. The International Energy Agency called it “the largest supply disruption in the history of the global oil market.” The question that governments, energy companies, central banks, and military planners around the world are now asking with unprecedented urgency is the one that previously seemed almost too extreme to model seriously: what would actually happen if the Strait of Hormuz never fully reopened?
The current crisis has produced a partial, temporary answer — and it is severe enough to make the permanent scenario genuinely alarming. This cornerstone analysis examines the question with the depth it deserves: the geography that makes the strait irreplaceable, the alternative routes that fall catastrophically short, the precise economic consequences across every sector and region, and what a world permanently reorganized around Hormuz closure would eventually look like.
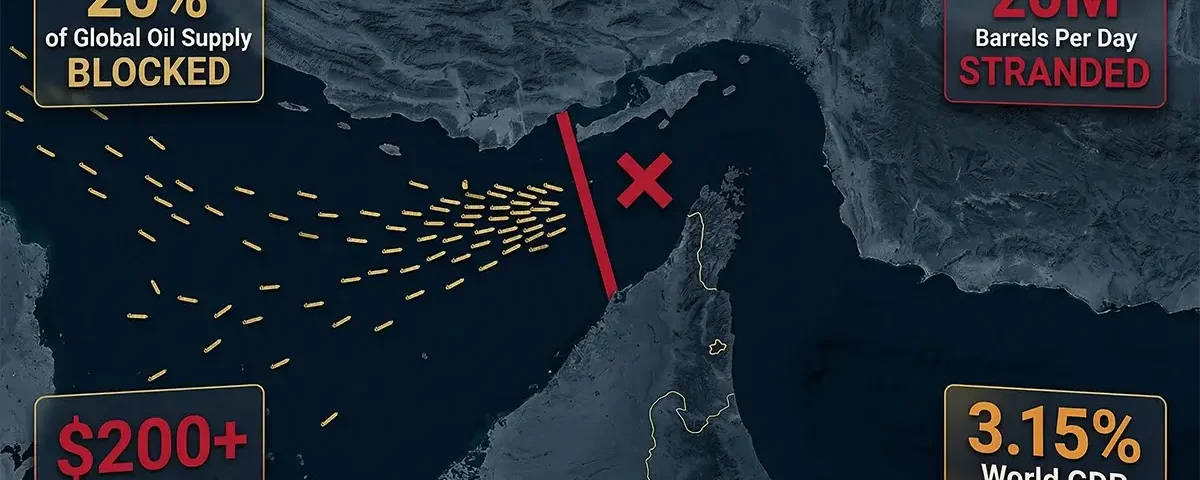
The Strait of Hormuz carries approximately 20–21 million barrels of oil per day — roughly 20% of global supply and 34% of all seaborne crude trade — through a channel just 21 miles wide at its narrowest navigable point. Existing bypass infrastructure can reroute at most 3.5–5.5 million barrels per day, leaving a 15+ million barrel-per-day deficit with no available substitute. A permanent closure would trigger oil prices of $150–$200+ per barrel, global GDP contractions of 3–5%, stagflation worse than the 1970s oil shocks, the collapse of multiple Gulf state economies, food crises across Asia and Africa, and a forced multi-decade restructuring of the entire global energy system. There is no scenario in which a permanent Hormuz closure is economically manageable. The only question is how severe and how prolonged the damage would be before new infrastructure, renewable transitions, and alternative supply chains could partially compensate.
The Geography of Irreplaceability: Why the Strait Cannot Simply Be Bypassed
The Strait of Hormuz is a narrow channel of water approximately 100 miles long and 21 miles wide at its narrowest navigable point, lying between Iran’s southern coast and the Omani exclave of Musandam. Its strategic importance derives not from its size — it is a genuinely small piece of ocean — but from the total absence of any equivalent alternative for the ocean of oil behind it.
In 2025, according to the International Energy Agency’s official Strait of Hormuz data page — showing that in 2025 nearly 20 million barrels per day transited the strait, representing 34% of all seaborne crude oil trade globally, nearly 20 million barrels per day of oil and petroleum products were exported via the Strait. This represents approximately 20–21% of global oil consumption, 34% of all seaborne crude oil trade, and essentially 100% of the seaborne oil exports from Saudi Arabia, Iraq, Kuwait, the UAE, Qatar, Bahrain, and Iran. The countries receiving this oil are primarily in Asia: China and India combined received 44% of strait-transiting exports in 2025, with Japan and South Korea highly reliant on these flows. Europe receives only approximately 4% — 600,000 barrels per day — of strait exports, making Europe comparatively less exposed than Asia but still meaningfully affected.
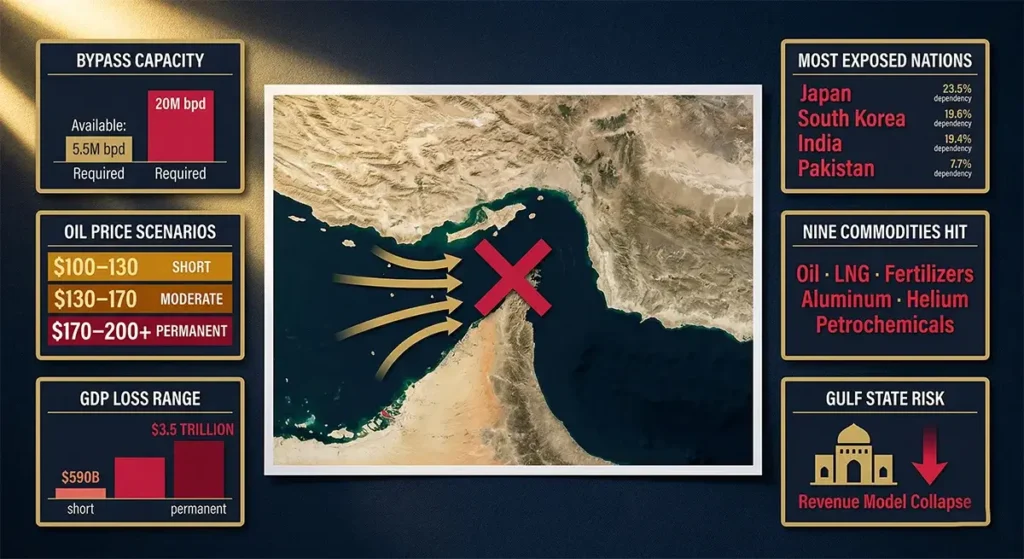
The critical physical fact — the one that makes “bypass the strait” responses to the closure question fundamentally inadequate — is captured in a single observation from the US Energy Information Administration’s official chokepoint analysis — documenting that combined bypass pipeline capacity of 3.5–5.5 million barrels per day falls far short of the 20 million barrels per day normally transiting the strait: “Some chokepoints have no practical alternatives.” The EIA estimates that available capacity on all existing alternative export routes from the Gulf region combined — the Saudi Petroline pipeline to Yanbu on the Red Sea, the UAE’s Habshan-Fujairah pipeline to the Gulf of Oman, Iran’s Goreh-Jask pipeline, and Iraq’s Kirkuk-Ceyhan pipeline to the Mediterranean — totals at most 3.5–5.5 million barrels per day. Against a normal strait flow of 20 million barrels per day, this means roughly 15 million barrels per day has no substitute route — it either flows through Hormuz or it does not flow at all.
To illustrate the scale of this deficit differently: a single supertanker carries approximately 2 million barrels of oil. Replacing 15 million barrels per day through land-based alternatives would require the equivalent of 7.5 supertanker-loads every day moved through pipelines that do not exist at sufficient scale. The Gulf News analysis put it starkly: “replacing just one supertanker shipment would require around 10,000 trucks, turning any land-based workaround into a massive logistical operation” — and the total deficit is 7.5 supertanker equivalents per day, indefinitely.
The Existing Bypass Routes: What They Can — and Cannot — Do
Understanding the alternative routes and their precise limitations is essential for evaluating both the current crisis and the permanent closure scenario. Each alternative has real but strictly limited capacity.
Saudi Arabia’s East-West Pipeline (Petroline): The largest alternative export route is Saudi Arabia’s Petroline — a roughly 750-mile system running from the Eastern Province to the Yanbu export terminal on the Red Sea coast. At full operational capacity, the pipeline can move approximately 5–7 million barrels per day, giving it more capacity than any other available alternative. However, the pipeline does not typically operate at full capacity — day-to-day utilization has been partial — and the 2026 crisis has revealed additional constraints: the pipeline requires both Yanbu port capacity and available tankers in the Red Sea to have meaningful impact, and the Red Sea itself has been partially disrupted by Houthi attacks since 2024. Pakistan officially requested Saudi Arabia reroute supplies through Yanbu in early March 2026, and Saudi Arabia arranged at least one crude shipment via this path, confirming the route is operationally viable for modest volumes.
UAE’s Habshan-Fujairah Pipeline (ADCOP): The UAE operates a 1.5–1.8 million barrel per day capacity pipeline linking onshore Abu Dhabi fields to the Fujairah export terminal on the Gulf of Oman — southeast of Hormuz and thus not requiring strait transit. The pipeline is already in regular use for UAE domestic export optimization, which means its available emergency surge capacity is limited. The IEA estimates available additional capacity at approximately 1.8 million barrels per day above current routine utilization, but this figure assumes the Fujairah terminal and the pipeline itself remain undamaged — which cannot be assumed in a continued conflict scenario given that the conflict has already involved attacks on Gulf infrastructure.
Iran’s Goreh-Jask Pipeline: Iran completed a pipeline to its own Jask terminal on the Gulf of Oman coast in 2021, designed specifically to allow Iranian oil exports without Hormuz transit. Its effective capacity is approximately 300,000 barrels per day — meaningful for Iran’s own export flexibility but inconsequential relative to the total strait flow. Iran has notably continued shipping millions of barrels of oil to China during the conflict, exploiting this route and demonstrating that Iran itself is not economically indifferent to the closure.
Iraq’s Kirkuk-Ceyhan Pipeline: Iraq’s northern pipeline exports approximately 400,000–500,000 barrels per day to the Turkish Mediterranean port of Ceyhan, bypassing the Gulf entirely. However, this pipeline has faced operational disruptions from Kurdish regional political disputes and has historically run below capacity. It provides a meaningful but small supplement to Iraq’s export options.
The Cape of Good Hope Route: When both Hormuz and the Red Sea/Suez Canal are unavailable — the situation that developed in 2026 given that the Red Sea was already partially disrupted by Houthis before the Iran war — tankers must reroute around Africa’s Cape of Good Hope. This adds 10–14 days and thousands of additional nautical miles to Asia-Europe journeys. Critically, this route does not solve the production shut-in problem: Gulf oil producers who cannot export through Hormuz cannot send tankers around Africa because their storage fills and production must stop. The Cape route helps buyers divert existing non-Gulf supplies but does not help Gulf producers export their shut-in production.
The aggregate conclusion from examining all alternatives: maximum available bypass capacity is 5.5 million barrels per day against a normal Hormuz flow of 20 million, leaving a structural deficit of at minimum 14.5 million barrels per day — 72.5% of normal strait flows — with no available route.
The Oil Price Consequences: Three Scenarios Modeled
The Dallas Federal Reserve published quantitative modeling of the Hormuz closure’s oil price and GDP consequences in March 2026, providing the most authoritative publicly available analysis of the economic impact across different closure duration scenarios.
According to the Dallas Fed research, even the partial disruption that has materialized to date — with tanker traffic down 90% from normal but not at absolute zero — was projected to raise WTI crude prices to approximately $98 per barrel and lower global real GDP growth by an annualized 2.9 percentage points in Q2 2026. Actual market prices in early April 2026 have tracked closely to this projection, with WTI reaching $102 and Brent crossing $112.
SolAbility’s independent analysis modeled three explicit scenarios for global GDP loss:
| Scenario | Duration | Global GDP Loss | Oil Price | Inflation Impact |
|---|---|---|---|---|
| Short disruption — rapid resolution | 4–6 weeks | −$590 billion | $100–$130/bbl | +1.5–2.5pp globally |
| Moderate disruption — summer resolution | 3–6 months | −$1.2 to −$2.0 trillion | $130–$170/bbl | +3–5pp; stagflation risk |
| Prolonged/permanent closure | 12+ months | −$3.5 trillion (3.15% of world GDP) | $170–$200+/bbl | +5–8pp; global recession |
The permanent closure scenario — the question this analysis addresses — would produce the third scenario’s immediate impacts and then compound them as the structural absence of Gulf supply forces a fundamental reorganization of the global energy system. Oil at $170–$200+ per barrel is not a sustained equilibrium: at those prices, demand destruction, recession, accelerated renewable deployment, and unprecedented conservation measures would all begin reducing demand. But the transition from a world dependent on Gulf oil to a world operating without it would take years to decades, during which the pain would be severe and widespread.
Beyond Oil: The Nine Commodity Disruptions Nobody Is Talking About
The economic consequences of a permanent Hormuz closure extend far beyond gasoline prices and crude oil. The World Economic Forum’s April 2026 analysis documented nine major commodity categories beyond oil that transit the strait and would be disrupted by permanent closure — and several of these secondary disruptions may ultimately produce more severe humanitarian consequences than the oil shock itself.
Liquefied Natural Gas (LNG): Qatar is the world’s largest LNG exporter, and virtually all of its LNG exports transit Hormuz. QatarEnergy declared force majeure on all LNG exports shortly after the strait’s effective closure in early March 2026 — an unprecedented action from one of the world’s most critical energy suppliers. Qatar’s LNG represents approximately 30% of global seaborne LNG trade. Countries most affected include Japan (which sources approximately 80% of Gulf LNG through Hormuz), South Korea, China, and Taiwan. In the short term, these countries can draw down storage. In a permanent closure scenario, the LNG supply gap would require years of new production development in Australia, the United States, Norway, and other non-Gulf sources — production that does not currently exist at the required scale.
Nitrogen Fertilizers (Urea and Ammonia): The Persian Gulf region is one of the world’s largest producers of nitrogen fertilizers — urea and ammonia — because natural gas (which is 70–90% of ammonia production costs) is abundantly and cheaply available there. The Gulf accounts for approximately one-third of global urea production and one-quarter of ammonia supply. These fertilizers are the essential input for global grain production — without adequate nitrogen fertilizer, crop yields fall by 30–50%. The LSE Business Review identified fertilizer as representing “one of the biggest downstream risks” of the Hormuz crisis. A permanent closure would eliminate Gulf fertilizer exports, forcing global agricultural production to either rely on significantly reduced fertilizer supply or dramatically higher-cost fertilizer from non-Gulf producers — driving food prices to crisis levels that would be most devastating in food-import-dependent low-income countries across Africa and South Asia.
Aluminum and Petrochemicals: The UAE is a major global aluminum producer, with energy-intensive smelting operations powered by cheap Gulf gas. Gulf petrochemical exports — plastics, synthetic rubber, industrial chemicals — transit Hormuz for delivery to manufacturing industries worldwide. CNBC reported that “aluminum is a good example” of downstream commodity disruptions — with Gulf production curtailed by the closure, manufacturers from automotive to aerospace to packaging would face aluminum price surges and supply shortfalls. Petrochemical disruptions would cascade into consumer goods pricing across every product category that uses plastic or synthetic materials.
Helium: Qatar is the world’s second-largest helium producer and supplies approximately 30% of global helium consumption. Helium is not merely a party balloon gas — it is an essential industrial material for MRI scanners, semiconductor manufacturing (required to purge and cool chip fabrication processes), fiber optic cable production, and specialized scientific research. A permanent Hormuz closure and consequent elimination of Qatar’s helium exports would create a severe helium shortage affecting semiconductor supply chains, hospital MRI capacity, and multiple advanced manufacturing industries.
Shipping Insurance and Maritime Commerce: Even beyond the specific commodities that transit Hormuz, a permanent closure would fundamentally restructure global maritime insurance pricing and route economics. War-risk ship insurance premiums for Hormuz transit had already increased from 0.125% to 0.2–0.4% of vessel value per transit before the current closure. A permanent closure — with the associated normalization of the geopolitical risk premium — would make shipping to and from Gulf ports through alternative routes significantly more expensive on a permanent basis, imposing a permanent tariff-equivalent cost on all Gulf trade that does continue through bypass infrastructure.
The Gulf State Economies: Collapse Without Export Revenue
A permanent Strait of Hormuz closure would be catastrophic for the Gulf Cooperation Council (GCC) states — Saudi Arabia, UAE, Kuwait, Qatar, Bahrain, and Oman — as well as Iraq. These economies are fundamentally dependent on hydrocarbon export revenue for government financing, social welfare provision, and economic stability. Without the ability to export their oil and gas, the economic model collapses.
The current closure has already demonstrated the mechanism: Iraq began shutting down operations at the Rumaila oil field — one of the world’s largest — in early March 2026 because with tankers unable to leave the strait, storage capacity filled and production had to stop. Kuwait and Saudi Arabia similarly began curtailing production. Collective GCC and Iraqi oil production dropped by 6.7 million barrels per day by March 10, 2026, and by at least 10 million barrels per day by March 12 — representing the cessation of a significant fraction of these countries’ primary economic activity.
Saudi Arabia’s Vision 2030 economic diversification program — designed to reduce the kingdom’s dependence on oil revenue — is still in its early stages. As of 2026, hydrocarbon revenues still account for approximately 60–70% of government revenue. A permanent inability to export oil would eliminate the primary funding source for government services, subsidies, and development programs. The social contract in Gulf states — which exchanges significant government resource distribution for political stability — would face immediate stress. The UAE, which has the most diversified Gulf economy (financial services, tourism, logistics), would face the longest before crisis point, but no GCC state has developed sufficient non-oil revenue to sustain current government spending levels without export income.
The Wikipedia economic impact analysis of the 2026 Iran war described a “systemic collapse of the Gulf Cooperation Council economic model” — and this characterization, while stark, accurately reflects the dependency structure of these economies on the free flow of maritime oil exports through Hormuz.
The Asia Crisis: The Most Severe Regional Consequence
If a permanent Hormuz closure would devastate Gulf producer economies, the most severe demand-side crisis would unfold across Asia — specifically in Japan, South Korea, India, and to a lesser but still significant extent, China.
Japan is among the most exposed of all large economies. Approximately 80% of Japan’s oil imports transit Hormuz. Japan has minimal domestic energy production, negligible strategic petroleum reserves relative to consumption rates compared to the crisis buffer they would require in a permanent closure scenario, and a manufacturing-dependent economy that requires continuous energy imports to function. A permanent Hormuz closure without an alternative supply solution would threaten Japanese industrial production on a scale not seen since the US oil embargo of World War II.
South Korea faces similar structural exposure — approximately 70% of its oil imports transit Hormuz — and as a major semiconductor, automotive, and shipbuilding manufacturer, Korean industrial production depends on both the oil itself and the stable functioning of global supply chains that the closure disrupts. The Philippines, Thailand, Malaysia, and Bangladesh are similarly exposed, with 60–95% of crude imports coming from the Middle East via Hormuz.
India is the world’s third-largest oil importer, with approximately 60% of its crude sourced from the Middle East. India has somewhat more geographic flexibility than Japan or Korea — it has direct shipping access to the Persian Gulf from its western coast — but the closure of Hormuz means the source of that oil (Gulf production) is curtailed regardless of India’s ability to receive alternative supplies. In a permanent closure scenario, India would face both energy security crisis and food security crisis simultaneously, as the fertilizer supply disruption compounds the energy supply disruption.
China, which imports approximately 44% of Hormuz-transiting oil combined with India, faces a different political dimension: China has been Iran’s primary oil buyer during the conflict, and Iran has continued limited exports to China through its Goreh-Jask bypass route. A permanent closure that somehow preserved Iranian-Chinese oil flows (at Goreh-Jask’s 300,000 barrel per day capacity) while blocking all other Gulf flows would give China a relative supply advantage over other Asian importers — a geopolitical dimension of the closure that strategists in Washington, Tokyo, and Seoul have noted.
What the 1970s Tell Us — and Where the Comparison Breaks Down
Every analysis of the Hormuz closure references the 1970s oil shocks — the 1973 Arab oil embargo and the 1979 Iranian Revolution — as historical comparisons. These comparisons are instructive but incomplete, and understanding where 2026 is worse than 1973 is essential for calibrating the permanent closure scenario.
The 1973 Arab oil embargo disrupted approximately 7–10% of global oil supply. The 1979 Iranian Revolution disrupted approximately 10–15%. The 2026 Hormuz closure has disrupted approximately 20% — larger than either historical precedent. Both historical shocks produced global recessions and, in the 1973–75 case, genuine stagflation. The 2026 scenario exceeds their scale and comes with several compounding vulnerabilities that the 1970s did not have.
First, 2026 global economies are more indebted than 1970s economies, with less fiscal headroom to deploy stimulus or support measures. Government debt-to-GDP ratios are double or triple 1970s levels across major economies. Second, the 2026 disruption coincides with existing inflationary pressure from tariffs and the post-COVID price cycle — unlike 1973, which occurred from a relatively low-inflation starting point. Third, the 1970s shocks were ultimately resolved by reduced demand (recession) and new supply (North Sea, Alaska, Gulf of Mexico production development). In a permanent Hormuz closure, the supply development path is severely constrained because Gulf production would cease — the very supply that contributed to the post-1973 recovery is unavailable in a permanent closure scenario.
Where 2026 is better positioned than 1973: the US is now a net oil exporter, producing a record 13.6 million barrels per day of domestic crude — providing meaningful insulation. Renewable energy has achieved commercial scale that simply did not exist in 1973, meaning the long-run transition away from Gulf oil dependence has a viable technological pathway. Strategic petroleum reserves, which were largely nonexistent in 1973, now provide a buffer of approximately 1.2 billion barrels across IEA member countries — though even the unprecedented 400 million barrel release announced in March 2026 represents only weeks of coverage at the scale of the disruption.
What Would Actually Happen: A Permanent Closure Timeline
Projecting the specific sequence of consequences from a hypothetical permanent Strait of Hormuz closure allows a more concrete understanding of what the world would actually experience, month by month and year by year.
Days 1–30 — The Emergency Phase: Strategic petroleum reserve releases from IEA member countries buy time. Oil prices spike to $130–$150/bbl as physical scarcity emerges in Asia after transit stocks are drawn down. QatarEnergy force majeure on LNG exports creates immediate gas supply crisis in Japan, South Korea, and Europe. Gulf oil production begins curtailing as storage fills. Asian governments implement emergency rationing and demand reduction measures — the Philippines implements a four-day work week, schools close, fuel restrictions begin. Global airline industry enters crisis as jet fuel prices more than double. Fertilizer prices surge as Gulf production and export cease.
Months 1–6 — The Contraction Phase: Global GDP begins measurably contracting. Recession materializes in multiple European economies. Japan, South Korea, and several Southeast Asian nations enter recession. The US, buffered by domestic production and strategic reserves, slows sharply but does not immediately contract. Global food prices begin rising as fertilizer scarcity reduces agricultural input availability. Manufacturing industries dependent on petrochemicals, aluminum, and Gulf-sourced materials face supply chain disruptions. Central banks globally face the stagflation trap: inflation at 5–8%+ requires rate hikes even as growth contracts.
Months 6–24 — The Restructuring Phase: Emergency investment in LNG capacity expansion begins in the US, Australia, and Norway — but new LNG projects take 3–5 years to produce first gas. Renewable energy investment surges as price signals make solar, wind, and storage more economically compelling than at any prior moment in history. Saudi Arabia, UAE, Kuwait, and Iraq exhaust sovereign wealth funds and begin fiscal crisis. Gulf state governments implement extreme austerity measures, reducing social welfare spending and potentially destabilizing political systems built on resource distribution. The global shipping industry restructures around longer, more expensive routes. US domestic oil producers benefit from elevated prices and ramp production — but cannot fully compensate for 15 million barrels per day of lost Gulf supply.
Years 2–10 — The Long Transition: A permanently closed Hormuz would force the fastest energy system transition in human history. New pipeline infrastructure, expanded renewable capacity, accelerated nuclear power deployment, and emergency LNG terminal construction would all begin bridging the gap — but each takes years to build. Non-Gulf oil-producing nations — US, Canada, Norway, Brazil, Guyana — would benefit from permanently elevated prices and would expand production, partially but not fully replacing Gulf supply. The global energy mix would shift dramatically toward renewables and nuclear, driven by economics rather than climate policy. Gulf state economies would fundamentally transform or face collapse, with severe humanitarian consequences for populations that have grown accustomed to resource-funded social welfare systems.
The Ceasefire Development and What It Means
As of early April 2026, a fragile US-Iran ceasefire was announced on approximately April 8, 2026, bringing cautious optimism to energy markets. The Strait has seen limited resumption of vessel traffic, though mine risks, coordination challenges, and the lack of a comprehensive diplomatic settlement mean full restoration is uncertain and potentially weeks away even in the optimistic scenario.
This ceasefire — even if it holds — does not resolve the permanent closure question. It demonstrates, rather, that the closure mechanism is real, operationally demonstrated, and available for Iran to deploy again in any future conflict or geopolitical leverage situation. The world has now seen, in real time, what a partial Hormuz closure produces in six weeks: $100+ oil, $4+ gas, 30–49% recession probability assessments, global GDP downgrades, and the IEA’s largest-ever emergency reserve release. The full permanent scenario modeled here — the one this article titles — is exponentially more severe.
The practical implication of this demonstrated vulnerability is that the global energy system’s decades-long dependence on Gulf oil flowing freely through a single narrow maritime chokepoint has been revealed as structurally unsustainable. Even if the 2026 Hormuz closure resolves favorably, the speed and scale of investment in alternative routes, renewable energy, and supply diversification that the crisis has catalyzed will permanently alter the energy investment landscape — because investors, governments, and energy companies have now seen the Hormuz risk scenario play out in real time, at unprecedented scale, and cannot unsee it.
The Long-Run Winners and Losers: How the World Reorganizes
A permanent or even extended Hormuz closure would produce a fundamental redistribution of geopolitical and economic power that would reshape the world order for decades.
Long-run winners: The United States, as the world’s largest oil producer with domestic supply sufficient to insulate itself from the most acute impacts, emerges with the largest relative advantage. US oil companies, LNG exporters, and renewable energy manufacturers all benefit from permanently elevated energy prices and accelerated global transition spending. Norway, Canada, Brazil, and Guyana — major non-Gulf oil producers — similarly benefit from elevated price signals that make their production economically advantaged. Renewable energy developers globally benefit from the fastest and most economically motivated energy transition in history. Countries with high renewable penetration — Uruguay with 98% renewable electricity generation, for example — face meaningfully lower exposure than fossil fuel-dependent peers.
Long-run losers: The Gulf oil-producing states face an existential economic challenge — their primary economic asset (Gulf oil) requires Hormuz for export, and permanent closure eliminates their revenue base. China, already dependent on Middle East oil and more exposed to Gulf LNG disruption than Western peers, faces the most severe sustained energy security challenge among major powers. Japan and South Korea, with minimal domestic energy production and historically high Gulf dependence, face multi-decade transition challenges. Low-income food-importing nations across sub-Saharan Africa and South Asia face the most severe humanitarian consequences from fertilizer disruption and resulting food price spikes — consequences that would generate humanitarian crises at a scale that dwarf the direct economic impact on wealthier nations.


💬 0 Comments