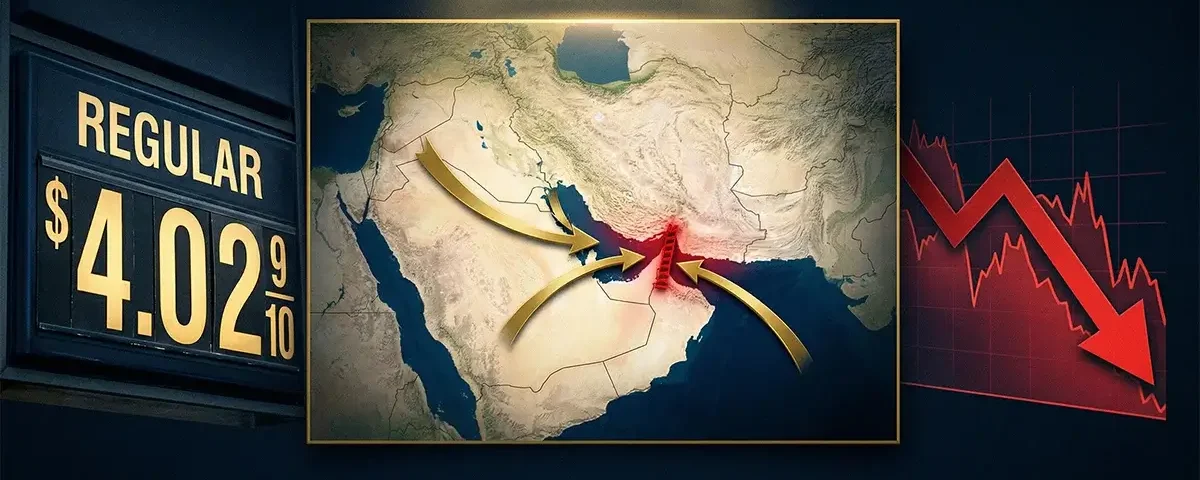
On February 28, 2026, the United States and Israel launched coordinated airstrikes on Iran, triggering a military conflict that has since evolved into the most severe global energy crisis since the 1970s Arab oil embargo. Iran’s response — closing the Strait of Hormuz, the narrow waterway through which approximately 20% of the world’s oil and liquefied natural gas normally flows — has produced what the International Energy Agency officially characterized as “the largest supply disruption in the history of the global oil market.” As of April 3, 2026, the Strait remains effectively closed, oil prices have crossed $100 per barrel and are threatening $130 and beyond, US gasoline prices have passed $4 per gallon for the first time since 2022, diesel prices have surged past $5.45 per gallon, and the question of whether the US economy will enter a recession in the next 12 months has moved from theoretical concern to the center of mainstream economic debate.
This cornerstone analysis examines every dimension of the Iran war’s economic impact on the United States — the energy shock mechanics, the inflation transmission channels, the recession probability assessments from every major forecasting institution, the sectors most severely affected, the government’s policy responses and their limitations, and the practical financial steps every American household should be taking right now.
The Iran war has introduced a simultaneous inflation shock and growth shock to an American economy that was already weakening before hostilities began. Goldman Sachs has raised its 12-month US recession probability to 30%. EY-Parthenon’s chief economist puts it at 40%. The OECD forecasts US inflation reaching 4.2% in 2026 — 1.2 percentage points above pre-war projections. The critical variable is time: if the Strait of Hormuz reopens by mid-April, the economic damage — while significant — is likely containable. If it remains closed through the summer, economists warn of a 1970s-style stagflation scenario that would almost certainly produce a US recession.
The Strait of Hormuz: Why One Waterway Controls the American Economy
To understand why a military conflict 7,500 miles from the American Midwest is causing US gasoline prices to spike by more than $1 per gallon in a single month, it is necessary to understand the Strait of Hormuz’s unique role in the global energy system. The Strait — a narrow channel approximately 100 miles long and 21 miles wide at its narrowest navigable point, bordering Iran on its northern shore — is the single most important oil chokepoint on Earth. There is no alternative of equivalent capacity.
In 2024, approximately 20% of the world’s total oil supply — and approximately 20% of its liquefied natural gas — transited the Strait daily. This includes the vast majority of crude oil exported by Saudi Arabia, Iraq, Kuwait, the United Arab Emirates, Qatar, and Iran itself. The countries most directly affected are in Asia: China, India, Japan, and South Korea collectively accounted for approximately 70% of the crude oil flowing through Hormuz, with about 80% of Qatar’s LNG exports — which power homes and industries across Asia and Europe — also transiting the strait. But the consequences of disruption are not confined to direct buyers. Oil is priced on global markets, and a supply shock that removes 20% of world supply does not produce 20% higher prices for Asian buyers while leaving American consumers unaffected. It produces higher prices everywhere — including at every gas station in the United States.
Iran’s effective closure of the Strait since early March 2026 has already produced what former Treasury official Steve Rattner called the largest oil supply disruption in history: the Arab oil embargo of 1973 disrupted approximately 7–10% of global oil supply; the Iranian Revolution of 1979 disrupted approximately 10–15%. The 2026 closure is disrupting approximately 20% — more than either historical precedent that preceded global recessions. “Many of us remember the 1970s,” Rattner said in an April 2 analysis. “The 1970s embargoes cost us less than 10% of the world’s oil. This is 20% of the world’s oil.”
The Oil Price Shock: From $59 to $100+ in Five Weeks
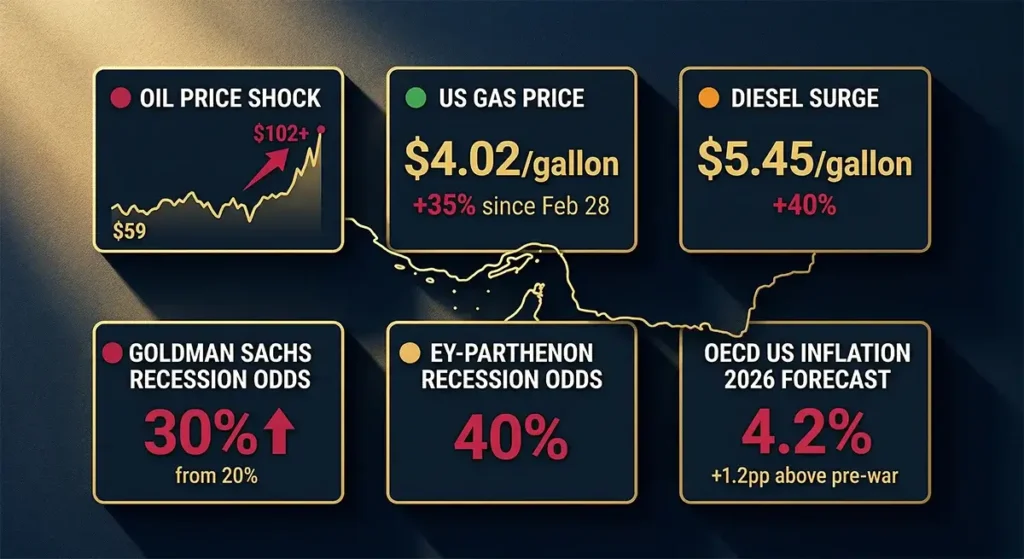
The speed and scale of the oil price shock has been extraordinary. West Texas Intermediate (WTI) crude — the US benchmark — stood at approximately $59 per barrel at the start of 2026. By April 2, 2026, it was trading at approximately $102 per barrel — a 73% increase in roughly five weeks. Brent crude, the international benchmark, reached approximately $112 per barrel. Oil prices are already up more than 50% from the conflict’s outbreak on February 28, and Brent crude is on pace for its largest monthly gain since the futures contract was created in 1988.
The trajectory ahead is the most consequential economic question in the world right now. Chevron CEO Mike Wirth, Shell CEO Wael Sawan, and energy executives gathered at S&P Global’s CERAWeek conference in Houston in late March expressed near-uniform concern that the Strait must reopen by mid-April or conditions deteriorate sharply. “The situation remains highly volatile and unpredictable,” said Patrick De Haan of GasBuddy. “We haven’t seen the brunt of it yet,” warned Samantha Gross, director of energy security at the Brookings Institute. The concern is that the current market prices reflect optimistic scenarios — a relatively prompt resolution — while physical oil markets, particularly in Asia and increasingly in Europe, are already trading at severe premiums reflecting actual scarcity.
Bloomberg’s economic modeling identifies three distinct price scenarios with materially different economic consequences:
| Oil Price Scenario | Brent Crude Level | US Inflation Impact | Global GDP Impact | US Recession Risk |
|---|---|---|---|---|
| Short conflict, quick resolution | Peaks ~$110, declines to ~$75 by Q4 | +0.5–0.8 pp above pre-war forecast | -0.2 to -0.3 pp | Elevated but manageable (~25–30%) |
| Moderate conflict, mid-year resolution | ~$130 sustained through Q2 | +1.2 pp (OECD forecast) | -0.5 to -0.8 pp | Significantly elevated (~35–45%) |
| Prolonged conflict, Hormuz stays closed | $150–$200, historically unprecedented | +2.0+ pp; stagflation territory | -1.0 to -2.0 pp; global recession likely | Near-certain recession (60%+) |
As of April 3, 2026, the market is pricing something between Scenario 1 and Scenario 2 — but the physical reality on the ground, where energy companies are warning of scarcity emerging in Europe and Asia within weeks, suggests Scenario 2 or worse is increasingly likely.
US Consumer Impact: Gas Prices, Diesel, and the Household Budget
The most immediate and visible economic consequence of the Iran war for American households is the surge in fuel prices. On April 1, 2026, the nationwide average for regular gasoline crossed $4 per gallon — the first time since August 2022 when Russia’s war in Ukraine shook energy markets. The AAA tracking data tells the story starkly: the national average was $2.98 on February 26, rose to $3.98 by March 26, and reached $4.018 by March 31 — a $1.04 increase in a single month, the largest monthly gain dating back to October 1990.
Diesel prices have risen even more sharply, with national averages surpassing $5.45 per gallon — a 40–45% increase from the start of the war. This matters enormously for the broader economy because diesel is the fuel of the economy’s supply chain: trucks that move groceries from warehouses to stores, construction equipment building homes and infrastructure, farm equipment producing food, and shipping vessels moving manufactured goods all run on diesel. RSM US chief economist Joe Brusuelas estimated that a 10% rise in diesel pushes the headline Consumer Price Index higher by 0.1%. The 40%+ diesel surge implies an approximately 0.4 percentage point direct CPI contribution from diesel alone — before accounting for the cascading price effects on everything diesel-fueled goods move and produce.
Patrick De Haan of GasBuddy has warned that gas prices could conceivably reach $5 per gallon nationally if the Strait of Hormuz bottleneck is not resolved — and California has already reached $5.87 on average, with some stations above $6. Jeremy Siegel, senior economist at WisdomTree, noted that gasoline is “the most visible price in the economy for consumers, and when that price jumps it hits psychology immediately” — meaning the confidence effect of rising gas prices exceeds even its direct budget impact on household spending decisions.
The household math is not abstract. For a typical American household driving 15,000 miles per year in a vehicle averaging 28 miles per gallon, the increase from $2.97 to $4.02 per gallon represents approximately $562 in additional annual fuel costs. For families with two vehicles, longer commutes, or less fuel-efficient trucks and SUVs, the additional cost exceeds $1,000–$1,500 per year — a significant sum for households that are already financially stressed from the prior inflationary period and carrying record credit card balances.
The Inflation Outlook: OECD, Goldman Sachs, and the Stagflation Warning
Before the Iran war began, the Federal Reserve’s baseline forecast anticipated US inflation declining toward the 2.5–2.8% range in 2026 — uncomfortably above the 2% target but on a downward trajectory that would have permitted gradual rate cuts. The energy shock has upended this scenario comprehensively.
The OECD now forecasts US inflation at 4.2% for 2026 — 1.2 percentage points above pre-war projections. Goldman Sachs estimates higher global energy prices will boost US inflation by 0.2 percentage points to 3.1% by year-end — a more conservative estimate that assumes a shorter conflict duration. Multiple Wall Street institutions project inflation “closer to 3% than 2%” this year, with the range of uncertainty extending to 4%+ if the conflict drags into the summer. Former IMF chief economist Gita Gopinath calculated that if oil prices average $85 per barrel in 2026 — already well below current levels — global economic growth would be 0.3 to 0.4 percentage points lower than pre-war forecasts.
The most alarming economic precedent being invoked across research institutions is stagflation — the devastating combination of rising inflation and slowing or contracting economic growth that characterized the 1970s oil shock era. Harvard Kennedy School economist Carmen Reinhart, a former World Bank chief economist, was direct: “You’re raising the risk of higher inflation and lower growth.” MIT energy economist Christopher Knittel stated even more bluntly: “Historically, oil price shocks like this have led to global recessions.” Sam Ori of the University of Chicago’s Energy Policy Institute identified a specific threshold: “When oil prices have reached 4 to 5 percent of GDP and stayed elevated, that’s always triggered a recession.” At $130–$140 per barrel sustained for the full year, the US economy would approach this threshold.
The Federal Reserve’s dilemma is acute. Standard monetary policy in a recession calls for rate cuts to stimulate economic activity and employment. But rate cuts in a high-inflation environment risk allowing inflation to become entrenched — the exact policy mistake of the 1970s that required Paul Volcker’s painful 20% interest rates to eventually resolve. Chair Jerome Powell indicates the awareness of this stagflation risk, and the Fed’s rate-cutting trajectory — already tentative before the war — has been further constrained. The ECB explicitly postponed planned rate reductions on March 19, raising its 2026 inflation forecast and cutting GDP growth projections.
The Recession Probability Dashboard: What Every Major Institution Is Saying
The shift in recession probability assessments since February 28, 2026 represents one of the most dramatic changes in economic consensus in recent memory. Before the war, most major forecasters placed the 12-month US recession probability at 15–25% — elevated by pre-existing tariff concerns and labor market softening, but not at crisis levels. In five weeks, that consensus has shifted dramatically upward.
| Institution / Analyst | Pre-War Recession Probability | Current Probability (April 2026) | Key Conditions |
|---|---|---|---|
| Goldman Sachs | ~20% | 30% | Oil at $100+; unemployment projected to 4.6% by end 2026 |
| EY-Parthenon (Gregory Daco) | ~35% | 40% | “Normal” background risk is 15%; war has nearly tripled it |
| Morgan Stanley | N/A | “Elevated” — dependent on conflict duration | Sustained conflict “significantly” raises odds |
| OECD | N/A | Inflation at 4.2%; GDP growth materially downgraded | US “outperforms” Europe but faces real slowdown |
| Chatham House | N/A | Moderate scenario: US slowdown but not contraction; prolonged: recession likely | Depends on whether Hormuz reopens before Q3 |
| Bloomberg Economics | N/A | At $170 oil: “stagflationary shock that could shift everything” | Doubling of inflation and growth hit vs $110 scenario |
Crucially, the US economy entered this crisis already showing weakness. GDP growth had slowed to an annualized pace of just 0.7% in Q4 2025 — down from a strong 4.4% in Q3 2025. Employers unexpectedly cut 92,000 jobs in February 2026 and had added an average of just 9,700 jobs per month in 2025 — the weakest hiring outside of an actual recession since 2002. The economy was not starting from a position of strength when the energy shock hit; it was already in a fragile deceleration that made the oil shock’s impact more destabilizing than it would have been during a period of robust growth.
Sectors Most Severely Affected by the Iran War
Transportation and Airlines
Jet fuel costs have more than doubled since the conflict began, producing an immediate crisis for the aviation industry. The global airline industry had forecast record profits of $41 billion for 2026 before the war; those projections are now meaningless. Before the conflict, an economy class ticket from Sydney to London on Cathay Pacific cost approximately $1,370; it now exceeds $2,000, with some dates pricing above $3,500. Korean Air has moved to “emergency management mode.” Air New Zealand, Vietnam Airlines, and multiple Asian carriers have begun cutting flights. China has banned jet fuel exports. US carriers face the same fuel cost surge, with airline ticket prices expected to increase significantly through Q2 and Q3 2026 as higher fuel surcharges pass to passengers.
Agriculture and Food Supply
The Strait of Hormuz crisis has triggered a second, less-visible but potentially more damaging supply shock: fertilizer. The Persian Gulf accounts for approximately one-third of global urea production and one-quarter of ammonia supply — both critical nitrogen fertilizers for global agriculture — because natural gas (70–90% of ammonia production costs) is abundant and cheap in the region. With Gulf fertilizer exports disrupted and spring planting season imminent in the Northern Hemisphere, agricultural economists at the American Farm Bureau warn that US farmers face significantly higher input costs for the 2026 growing season. Higher fertilizer costs translate to higher food prices in 2026 and 2027 — adding a food inflation component to the energy inflation already radiating through the consumer price index. Grocery prices, which consumers are already watching anxiously, will face additional upward pressure through this agricultural supply chain channel.
Manufacturing and Industrial Production
US manufacturing — already contracting in the ISM Manufacturing PMI for most of the past 18 months — faces additional headwinds from multiple directions simultaneously. Higher energy costs directly increase manufacturing operating expenses. Diesel surcharges on freight are raising the cost of raw material inputs and finished goods distribution. The Gulf is also a significant source of helium — a critical industrial gas used in semiconductor manufacturing, MRI machines, and dozens of specialized industrial applications. A shortage of Gulf helium could impact semiconductor production, with cascading effects on the automobile, electronics, and medical device industries.
Consumer Spending — The GDP Multiplier Risk
Consumer spending accounts for approximately two-thirds of US economic output — meaning its trajectory is the single most important variable in any recession assessment. The Iran war threatens consumer spending through three simultaneous channels. First, higher gasoline and energy prices directly reduce disposable income available for other spending — every dollar spent filling a gas tank is a dollar not spent at a restaurant, retail store, or entertainment venue. Second, rising gas prices produce an immediate and measurable psychological effect on consumer confidence that historically causes households to defer discretionary purchases and major financial decisions. Third, the broader uncertainty created by an ongoing military conflict — with no clear resolution timeline — causes both consumers and businesses to delay spending and investment decisions, producing the demand contraction that turns an economic slowdown into a recession.
EY-Parthenon’s Gregory Daco captured the feedback loop: “The combination of tighter financial conditions, more uncertainty and higher inflation is going to erode growth. We’ve curbed our growth forecast down and increased the odds of recession on the basis that if this conflict becomes more severe or prolonged, then you would see a more visible risk of a downturn in the economy.”
The Government’s Policy Response: Tools Available and Their Limits
The Trump administration has deployed several tools to mitigate the oil shock’s consumer impact, with mixed effectiveness.
Strategic Petroleum Reserve release: The US and international allies are releasing approximately 400 million barrels from strategic reserves — described as the largest coordinated strategic reserve release on record. The US component involves releasing 172 million barrels from the Strategic Petroleum Reserve. While this provides meaningful short-term relief — the reserve release estimates to take approximately 120 days to fully deliver to market — it does not solve the structural problem of the Strait closure. The SPR has finite capacity, and its release buys time rather than replaces the disrupted supply permanently. Energy Secretary Chris Wright acknowledged to CNBC that the administration is working on additional diesel supply measures, citing plans to “bring extra diesel to the marketplace.”
Temporary sanctions relief: The administration has temporarily lifted sanctions on some Russian and Iranian oil to provide the market additional breathing room. This is a short-term measure with significant geopolitical complications — particularly the optics of lifting Iranian sanctions while simultaneously conducting military operations against Iran — and limited scale relative to the disruption.
Potential federal fuel tax suspension: Congress is considering suspending the federal excise tax on fuel — approximately 18 cents per gallon on gasoline and 24 cents per gallon on diesel. This measure, if enacted, would provide modest immediate relief but represents only a fraction of the $1+ per gallon increase already experienced.
The fundamental policy constraint: The US government’s most effective single tool for reducing energy prices would be reopening the Strait of Hormuz to shipping traffic. President Trump’s April 2 declaration that the Strait would “automatically open” after US forces exit — and his suggestion that other countries should “go to the Strait and just TAKE IT” — has been criticized by energy economists as fundamentally misunderstanding the situation. Dan Pickering, chief investment officer at Pickering Energy Partners, called the idea of withdrawing without ensuring Strait reopening “a terrible idea,” warning it “creates more long-term problems than it solves in the short term.” Even if US forces exit, Iran has indicated it will impose tolls on ships transiting the Strait — an assertion Bahrain’s foreign minister described as “illegal and reckless.”
The 1970s Parallel: Is Stagflation Coming?
The 1970s are the unavoidable historical reference point for the current situation — and the comparison is not reassuring. The 1973 Arab oil embargo and the 1979 Iranian Revolution both produced oil price shocks that were followed by recessions and, in the 1973–1975 period, genuine stagflation — a condition where inflation remains elevated even as economic growth stalls or reverses, putting the Federal Reserve in a position where either fighting inflation or supporting growth requires sacrificing the other objective.
The current environment has several characteristics that parallel the 1970s stagflation setup: a supply-driven oil shock (as opposed to demand-driven inflation, which is more amenable to Fed tightening), pre-existing tariff-driven inflation that was already complicating the Fed’s decision-making, and a consumer sector that is already financially stressed from the prior inflation cycle. The critical difference: the US is now the world’s largest oil producer, pumping a record 13.6 million barrels per day — dramatically reducing (though not eliminating) its dependence on imported oil compared to the 1970s. This insulation means the US will likely outperform Europe and Asia in the energy shock scenario — but it does not make the US immune. Oil prices on global markets, and the gas pump in Omaha reflects the price of crude in Riyadh.
The stagflation risk is highest if the conflict extends into summer — when European gas storage refill season begins, when Asian countries’ emergency stockpile buffers are exhausted, and when the US’s strategic reserve releases approach their delivery limits. In that scenario, physical oil scarcity becomes the driver rather than financial market speculation, producing the kind of price spike that Sam Ori identified as historically recession-inducing: oil at 4–5% of GDP sustained for an extended period.
What the Iran War Means for Your Finances: Practical Steps
For American households and investors navigating this environment, the combination of elevated recession risk, energy shock inflation, and geopolitical uncertainty calls for a specific set of financial preparations — regardless of how the conflict ultimately resolves.
Reinforce your emergency fund immediately: The Iran war has materially increased the probability of job loss in consumer-facing industries (airlines, hospitality, retail, restaurants) over the next 6–12 months. If your emergency fund is below 6 months of essential expenses — the minimum appropriate for this risk environment — redirect discretionary spending toward building it. The energy shock reduces your household’s real disposable income through higher fuel and food costs; your emergency fund should be sized for the new, higher-cost reality.
Review your transportation costs and lock in savings where possible: If you drive a fuel-inefficient vehicle and have a lease expiration approaching, the current oil price environment strengthens the case for a more fuel-efficient alternative. Consider whether remote work options can reduce your weekly fuel consumption during the period of elevated prices. Carpooling, public transportation, and trip consolidation are all meaningfully more valuable at $4+ per gallon than at $3.
Expect grocery and goods inflation to accelerate in April–May: The diesel price surge has not yet fully worked through supply chains. GasBuddy’s De Haan specifically warned that “consumers could see the impact by April through higher prices at the supermarket and for their online orders.” Building a modest pantry buffer of non-perishable essentials over the next few weeks — before supply chain price increases fully materialize at the store level — is a practical hedge against the coming inflation wave.
Review your investment exposure to oil-price-sensitive sectors: If your portfolio has significant exposure to airlines, discretionary consumer stocks, or manufacturing companies with high energy input costs, the current environment warrants review with a financial advisor. Conversely, domestic US energy producers (oil and gas companies operating in the Permian Basin, Eagle Ford, and other domestic plays) benefit directly from higher oil prices and may represent a natural hedge within a diversified portfolio.
Monitor the Strait of Hormuz timeline as the critical financial variable: The single most important economic indicator for US households and investors over the next 30–60 days is the status of the Strait of Hormuz. Oil executives and analysts have identified mid-April as the critical window — beyond which the emergency buffer measures lose effectiveness and physical oil scarcity becomes the dominant market force. Track this daily through the EIA’s weekly petroleum status reports and major energy news sources. A Strait reopening would significantly reduce recession risk; a Strait closure extending beyond May would substantially increase it.
The Two Scenarios That Will Determine America’s Economic Fate
Every major economic institution’s assessment converges on a binary outcome determined primarily by one variable: how long the Strait of Hormuz remains effectively closed.
Scenario A — Resolution by mid-April: If diplomatic or military developments reopen the Strait to meaningful shipping traffic within the next two to three weeks, the economic damage — while significant — is likely containable. Oil prices would fall from current levels as the supply disruption begins to reverse. US inflation would peak near 3.5–4.0% in Q2 2026 and decline through the second half of the year. GDP growth would slow but likely remain positive. Recession probability would recede toward 25–30%. The 2026 economic slowdown would be a painful but ultimately manageable energy price episode rather than a full recession.
Scenario B — Prolonged closure through summer: If the Strait remains closed into May, June, and beyond — a scenario that appears increasingly likely given the lack of a clear diplomatic resolution path and President Trump’s apparent willingness to exit without guaranteeing reopening — the economic consequences become genuinely severe. Physical oil scarcity emerges across Asia and Europe. Prices spike toward $130–$170 per barrel. US gasoline approaches $5 per gallon. The CPI surges toward 4–5%. Consumer spending contracts sharply. Business investment freezes. The Federal Reserve is paralyzed between fighting inflation and preventing recession. The US slides into the 1970s-style stagflation scenario that every economist in this analysis has identified as the worst-case but increasingly plausible outcome.
The world economy is at an inflection point that will be determined in the next few weeks by events in a narrow channel of water off the coast of Iran. Every American household’s financial planning should be informed by this reality — because regardless of which scenario unfolds, the economic consequences are already in motion and will be felt at kitchen tables across the country before summer begins.

💬 0 Comments