Every month, a stream of government reports — jobs numbers, inflation readings, consumer confidence surveys, manufacturing data — moves stock markets, shapes Federal Reserve decisions, and determines whether economists begin quietly discussing the R-word. For the average American trying to understand where the economy is headed, these reports feel like a fire hose of confusing statistics. This guide explains the 10 most important economic indicators to understand in 2026, what each one measures, and how to use them to make better financial decisions.
Economic indicators fall into three categories: leading indicators (signal where the economy is going), coincident indicators (reflect current economic conditions), and lagging indicators (confirm trends after they occur). Monitoring 3–4 key leading indicators gives you meaningful advance warning of economic turning points — enough to make financial preparation decisions before a recession officially begins, which is typically declared 6–12 months after it starts.
Why Economic Indicators Matter for Your Personal Finances
Economic indicators are not just academic data for economists and investors. They are practical signals that affect when you should lock in a mortgage rate, whether to build up cash reserves, whether your industry is likely to see layoffs, and whether the Federal Reserve is likely to raise or cut interest rates. Americans who understand the leading indicators navigate recessions earlier and better than those who react only when the economy has already turned.
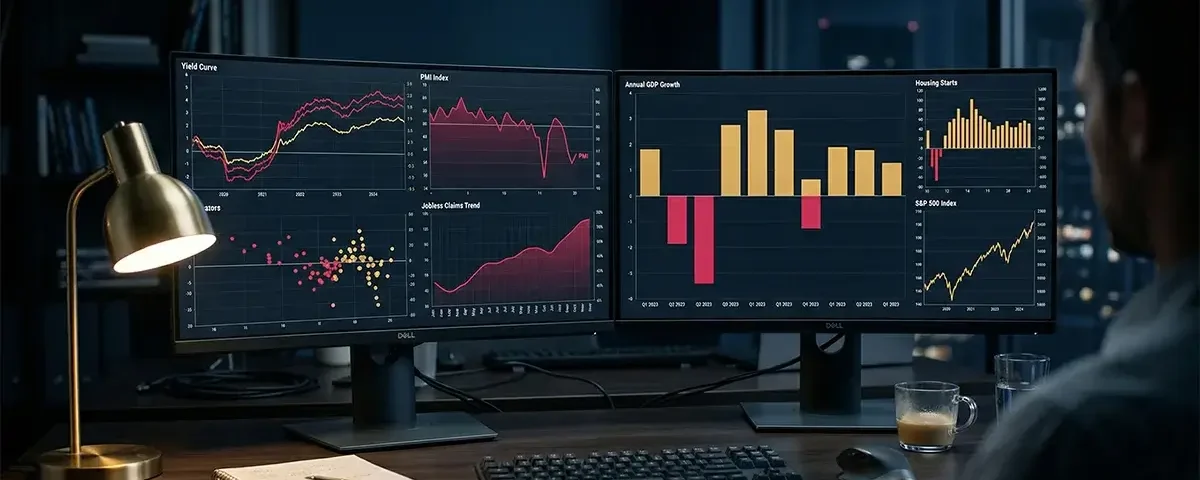
Leading Indicator 1: The Yield Curve (10-Year minus 2-Year Treasury Spread)
The yield curve — specifically the spread between the 10-year US Treasury yield and the 2-year Treasury yield — is one of the most reliable recession predictors in financial economics. Under normal conditions, longer-term bonds pay higher yields than shorter-term bonds (investors demand more compensation for tying up money longer). When the yield curve “inverts” — meaning 2-year yields exceed 10-year yields — it signals that investors expect short-term interest rates to fall in the future, typically because they anticipate a recession forcing the Fed to cut rates.
The 10-Year/2-Year spread has inverted before every US recession in the past 50 years, with a lead time of approximately 12–18 months. The yield curve inverted significantly in 2022–2023 — and remained inverted for an unusually prolonged period, which many economists cite as one of the key recession risk signals for 2025–2026. Track this indicator free at the Federal Reserve Bank of St. Louis’s FRED database (fred.stlouisfed.org/series/T10Y2Y).
Leading Indicator 2: ISM Manufacturing PMI
The Institute for Supply Management Manufacturing Purchasing Managers’ Index (PMI) is a monthly survey of manufacturing purchasing managers that produces a single number: above 50 indicates manufacturing sector expansion; below 50 indicates contraction. Released on the first business day of each month, it is typically the first major economic data point of the month and moves markets significantly.
The ISM Manufacturing PMI has preceded every US recession over the past 40 years. Sustained readings below 48 — not just a brief dip below 50 — have historically been associated with recession conditions or imminent recession. The PMI spent much of late 2025 and early 2026 below 50, providing a consistent recession warning signal. Track at ISM’s website (ismworld.org) — the report is released at 10 AM Eastern on the first business day of each month.
Leading Indicator 3: Initial Jobless Claims
Initial jobless claims measure the number of Americans filing for unemployment insurance for the first time each week. Released every Thursday by the Department of Labor, this is the most frequently updated labor market indicator available — providing a weekly (rather than monthly) read on whether layoffs are accelerating. Because it is reported weekly, initial claims react to economic changes faster than the monthly jobs report.
The threshold to watch: initial claims above 300,000 per week on a consistent basis (4-week moving average) signal a meaningful deterioration in labor market conditions. During the 2020 recession, weekly claims peaked above 6 million. During the 2008–2009 recession, they peaked near 665,000. As of early 2026, claims are running in the 215,000–240,000 range — elevated from the 2022 lows of 165,000 but not yet at recessionary levels. Track weekly at dol.gov/ui/data.pdf.
Leading Indicator 4: The Conference Board Leading Economic Index (LEI)
The Conference Board’s Leading Economic Index is a composite indicator that combines 10 different leading indicators into a single monthly reading, including: average weekly manufacturing hours, building permits, stock prices, the yield curve spread, consumer expectations, and others. A sustained decline in the LEI over 3–6 consecutive months — particularly if the 6-month growth rate turns negative — has historically preceded every US recession.
The LEI has declined for over 24 consecutive months as of early 2026 — an unusually long negative streak that the Conference Board itself has characterized as consistent with a recession or imminent recession risk. This sustained weakness across multiple components is one of the strongest recession warning signals in the current data set. The Conference Board releases the LEI in the third week of each month — available at conference-board.org.
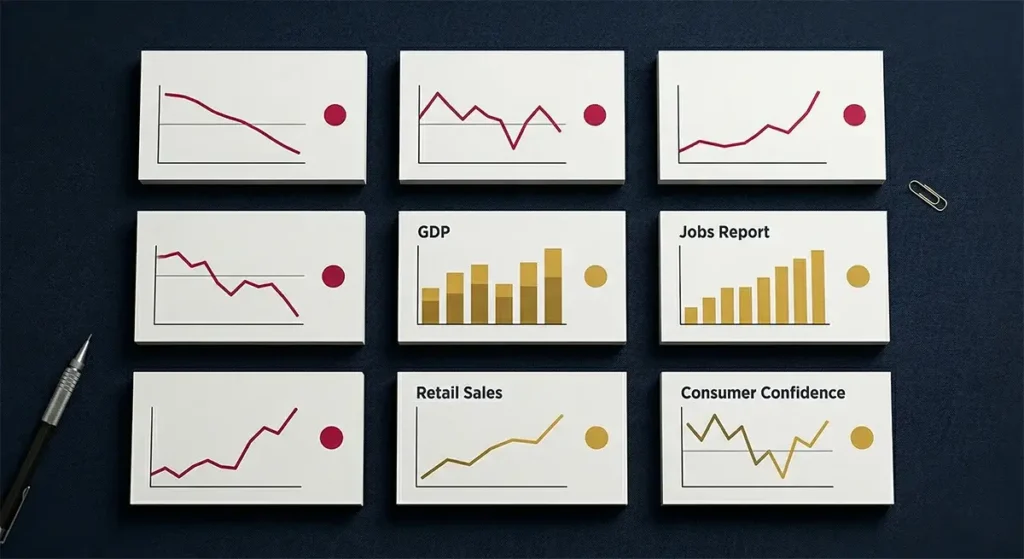
Coincident Indicator 1: GDP (Gross Domestic Product)
GDP is the broadest measure of total economic output — the monetary value of all goods and services produced in the United States in a given period. A recession is commonly defined as two consecutive quarters of negative real (inflation-adjusted) GDP growth, though the NBER’s official recession determination uses a more nuanced multi-indicator assessment.
The Bureau of Economic Analysis (BEA) releases three GDP estimates for each quarter: the Advance Estimate (released approximately 30 days after the quarter ends), the Second Estimate (60 days after), and the Third Estimate (90 days after). The Advance Estimate moves markets most significantly despite being subject to substantial revision. GDP data is available at bea.gov — search “GDP news release” for the most current release.
Coincident Indicator 2: Nonfarm Payroll Employment (The Jobs Report)
Released on the first Friday of each month by the Bureau of Labor Statistics, the monthly jobs report is arguably the most market-moving economic release in the US. It reports: total nonfarm payroll employment (how many jobs were added or lost), the unemployment rate, labor force participation rate, average hourly earnings (wage inflation indicator), and average weekly hours worked.
Key thresholds: monthly job gains below 100,000 indicate a slowing labor market; below 75,000 suggests possible contraction; negative numbers indicate the labor market has turned. The unemployment rate crossing 4.5% from below and continuing to rise is a significant recessionary signal. The Sahm Rule (a recession indicator calculated from the unemployment rate) automatically triggers when the 3-month average unemployment rate rises 0.5 percentage points above its 12-month low — a signal with a near-perfect historical accuracy rate for recession identification.
Coincident Indicator 3: Consumer Price Index (CPI)
The Consumer Price Index measures the month-over-month and year-over-year change in prices paid by urban consumers for a representative basket of goods and services. Released monthly by the BLS (typically in the second week of the month), CPI is the primary inflation measure used to calculate Social Security COLAs, adjust tax brackets, and guide Federal Reserve policy.
The key CPI components to monitor in 2026: core CPI (excluding food and energy, which are volatile) provides the cleanest read on underlying inflation trends; shelter inflation (the largest single CPI component at approximately 34% of the total) has remained stubbornly elevated due to the lagged way rental prices are measured in CPI; and services inflation (which reflects wage pressures more than goods inflation) is the component the Fed watches most closely as a signal of entrenched inflation.
Lagging Indicator 1: Unemployment Rate
Despite being the most widely reported labor market statistic, the unemployment rate is actually a lagging indicator — it continues rising for months after a recession has technically ended because employers are slow to resume hiring after a downturn. The unemployment rate peaked at 10% in October 2009 — 4 months after the recession officially ended in June 2009. This lag means a rising unemployment rate confirms an ongoing recession but does not predict one. Track monthly in the BLS Jobs Report.
Lagging Indicator 2: Consumer Credit
Total consumer credit outstanding — the aggregate level of auto loans, student loans, revolving credit card debt, and other consumer borrowing — is a lagging indicator that reflects the cumulative effect of past economic conditions on household balance sheets. Rapidly rising consumer delinquency rates (loans 30+ days past due) are a particularly meaningful lagging signal of financial stress spreading through the household sector. The Federal Reserve’s G.19 Consumer Credit report is released monthly and provides data on revolving and non-revolving credit growth rates.
How to Use These Indicators in Practice
You do not need to monitor all 10 indicators simultaneously. A practical personal finance monitoring system: check the weekly initial jobless claims every Thursday (takes 2 minutes — simply note if the 4-week average is trending up), read the monthly jobs report summary on the first Friday of each month, and note the monthly CPI headline number when released. These three data points, tracked monthly, provide sufficient signal to make informed financial preparation decisions — building emergency fund buffers, reducing discretionary spending, delaying major purchases — months before a recession is officially declared.


💬 0 Comments