
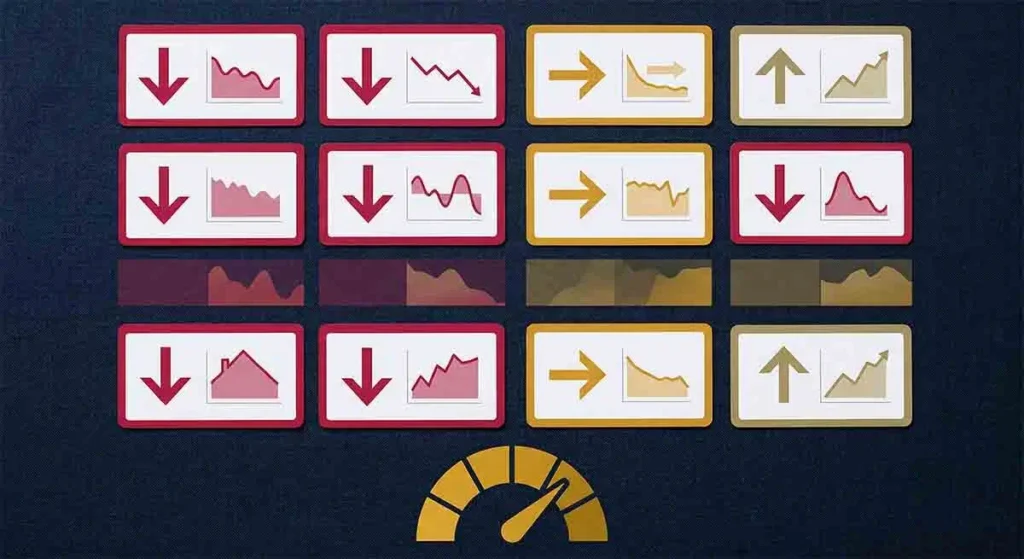
As April 2026 unfolds, a growing body of economic data is flashing warning signals that no responsible financial observer can ignore. From inverted yield curves to contracting manufacturing output, from rising unemployment claims to deteriorating consumer sentiment — the dashboard of recession indicators tracked by economists, the Federal Reserve, and the National Bureau of Economic Research (NBER) is producing readings that demand serious attention. This is not alarmism. It is a systematic review of where every major US recession indicator stood in April 2026 — and what the composite picture means for your financial decisions.
No single indicator definitively signals a recession — the NBER determines recession dating retrospectively using a broad set of criteria. But in April 2026, at least seven of the twelve most closely-watched leading and coincident economic indicators are in warning territory simultaneously. The last time this many indicators aligned negatively was in late 2007 — three months before the official start of the Great Recession. This does not guarantee a recession, but it warrants immediate financial preparation regardless of the ultimate outcome.
How the NBER Defines and Identifies Recessions
Before examining the indicators, it is essential to understand how recessions are officially defined. The National Bureau of Economic Research (NBER) — the nonpartisan research organization that officially dates US business cycles — defines a recession as “a significant decline in economic activity that is spread across the economy and lasts more than a few months.” Critically, the NBER does not rely solely on the popular “two consecutive quarters of negative GDP” definition — that is a useful rule of thumb, not the official standard.
The NBER’s Business Cycle Dating Committee examines a broad set of monthly indicators when determining recession start and end dates: real personal income less transfer payments, nonfarm payroll employment, real personal consumption expenditures, wholesale and retail sales adjusted for price changes, industrial production, and real GDP and GDI (Gross Domestic Income). The committee looks for a “significant, broad, and persistent” decline across these measures — meaning a brief GDP contraction quickly reversed does not necessarily constitute a recession, while a sustained moderate decline across multiple indicators does.
The NBER dates recessions with a significant lag — it typically takes 6–18 months after a recession begins before the committee officially declares it. This means that by the time a recession is officially announced, households and businesses are already well into it. This is why leading indicators — which tend to move in advance of the broader economy — are the most actionable for financial planning purposes.
Leading Indicators: The Forward-Looking Warning System
1. The Conference Board Leading Economic Index (LEI) — WARNING
The Conference Board’s Leading Economic Index is a composite of ten forward-looking components designed to signal turning points in the business cycle approximately 6–9 months in advance. The LEI has declined in 8 of the past 12 months through March 2026, with the 6-month annualized rate of change negative — a pattern that has preceded every recession since the index’s creation in the 1960s with no false positives when sustained for this duration.
The March 2026 LEI reading showed particular weakness in: building permits (housing sector forward indicator), new orders for nondefense capital goods excluding aircraft (business investment signal), and the yield spread between the 10-year Treasury and federal funds rate (financial conditions). Only the stock market component and average consumer expectations partially offset the weakness. The LEI’s current trajectory matches the pre-recession patterns of 2000–2001, 2007–2008, and 2019–2020.
2. The Yield Curve — SEVERE WARNING (Partially Resolved)
The yield curve — specifically the spread between the 10-year and 2-year Treasury yields — inverted (short-term rates exceeded long-term rates) in April 2022 and remained inverted for an unprecedented 26 months through June 2024. This inversion — historically one of the most reliable recession predictors with a 12–18 month lead time — has now partially resolved, with the curve steepening back to a modestly positive slope as of April 2026.
The re-steepening of an inverted yield curve is itself a recessionary signal — often more immediate than the inversion period itself. When the curve un-inverts through short-term rate declines (as the Fed cuts rates in response to deteriorating economic conditions), it typically marks the period just before or concurrent with recession onset. The 2024–2025 curve re-steepening following a historic inversion has occurred in the same pattern seen before the 2001 and 2008 recessions: inversion for 12+ months followed by rapid re-steepening driven by Fed rate cuts.
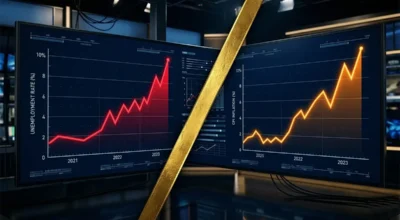
3. Initial Jobless Claims — WARNING
Initial claims for unemployment insurance — weekly filings of new unemployment benefit applications — provide the most real-time view of labor market deterioration available in the US economic data stream. As of the most recent four-week average through April 2026, initial claims have risen to approximately 245,000–255,000/week — elevated from the cycle low of approximately 195,000 in late 2023 but not yet at the 300,000+ threshold historically associated with confirmed recession conditions.
The trend matters as much as the level: initial claims have risen approximately 25–30% from their 2023 cycle lows over the past 12 months. A sustained 20%+ increase from cycle lows has historically been associated with recession onset within 6–9 months when accompanied by other confirming indicators. The April 2026 claims trajectory is consistent with early-stage labor market deterioration — not yet crisis-level, but meaningfully worsening from the tight conditions of 2022–2023.
4. ISM Manufacturing PMI — CONTRACTION
The Institute for Supply Management’s Manufacturing Purchasing Managers’ Index (PMI) measures the health of the US manufacturing sector through a monthly survey of purchasing executives. A reading above 50 indicates expansion; below 50 indicates contraction. The manufacturing PMI has been below 50 in 13 of the past 18 months as of April 2026 — consistent with a manufacturing sector in a prolonged soft recession driven by tariff disruptions, weakening export demand, and inventory destocking.
The new orders component — the most forward-looking element of the manufacturing PMI — is particularly concerning, sitting at approximately 46–47 in recent months, indicating declining order volumes. When new orders fall ahead of production, production cuts and layoffs typically follow within 2–3 months. The US manufacturing sector’s protracted weakness contrasts with its relative strength in 2021–2022 and signals that the tariff-driven supply chain restructuring has not yet produced the domestic manufacturing renaissance that policy advocates projected.
5. ISM Services PMI — NEUTRAL TO WEAK
The services sector — representing approximately 80% of US economic output — has been more resilient than manufacturing, but April 2026 readings have deteriorated from the comfortable expansion zone of 2023–2024. The services PMI stood at approximately 51–52 in March 2026 — barely above the expansion/contraction threshold. More concerning, the services new orders and employment components have both fallen to near 50 levels, suggesting the services expansion is losing momentum rather than accelerating.
Consumer-facing services sectors (retail, dining, entertainment, recreation) are experiencing the most significant demand softness, reflecting consumer balance sheet stress as pandemic-era savings fully deplete and credit card delinquency rates rise. Business-facing services (professional services, financial services, information technology) remain somewhat more resilient, supported by cost-reduction mandates that require professional service inputs even in a slowing environment.
Coincident and Lagging Indicators: Current Economic Reality
6. Nonfarm Payroll Employment — WEAKENING
Nonfarm payrolls — the monthly count of employed workers on business payrolls, reported by BLS on the first Friday of each month — remain one of the most politically and economically scrutinized indicators in the economic data calendar. Through March 2026, nonfarm payrolls have been growing at an average pace of approximately 120,000–140,000 jobs per month — below the 150,000 typically needed to absorb new labor force entrants, meaning the employment situation is technically deteriorating even as new jobs are being added.
More concerning than the headline is the composition: recent job growth has been heavily concentrated in government employment, healthcare, and social assistance — sectors that historically maintain employment through recessions — while private sector goods-producing employment (manufacturing, construction, mining) has been flat to negative. The “breadth” of job growth — the percentage of industries adding jobs simultaneously — has narrowed significantly from the broad-based growth of 2022–2023.
7. Real Personal Income Growth — WARNING
Real (inflation-adjusted) personal income excluding transfer payments — one of the NBER’s core recession dating indicators — has grown at approximately 1.2–1.5% year-over-year through February 2026, down from 2.5–3.0% a year earlier. While still positive, the deceleration reflects both nominal wage growth slowing as labor market tightness eases and persistent inflation (particularly in food, insurance, and services) eroding purchasing power. When real income growth falls below 1.0% — which current trends suggest is possible by mid-2026 — it enters territory historically associated with recession-concurrent conditions.
8. Consumer Confidence — RECESSION-LEVEL READING
The Conference Board Consumer Confidence Index and the University of Michigan Consumer Sentiment Index have both deteriorated sharply in early 2026. The Michigan Sentiment index fell to approximately 57–59 in February–March 2026 — below the 60 threshold that has historically been associated with recession or near-recession conditions. The Conference Board’s Present Situation component (which measures current economic assessment) has also fallen sharply, suggesting consumers are experiencing economic deterioration in their daily lives rather than just fearing future problems.
Consumer confidence is simultaneously a coincident indicator (reflecting current conditions) and a forward-looking indicator (consumer pessimism reduces future spending). The current confidence readings are consistent with households pulling back discretionary spending — a self-reinforcing dynamic that can convert economic slowdown into recession if sustained for multiple quarters.
9. Credit Card Delinquency Rates — RECESSION-TERRITORY
Credit card delinquency rates — the percentage of balances that are 90+ days past due — have risen to approximately 10–11% as of Q4 2025 (most recent available Federal Reserve data), exceeding the rates seen during the 2007–2009 financial crisis for credit cards specifically. This deterioration reflects the exhaustion of pandemic-era savings buffers and the accumulation of high-rate credit card debt that has become unsustainable for a growing segment of American households at current interest rates.
Rising delinquency rates have two economic consequences: they reduce future consumer spending capacity (delinquent borrowers cannot access new credit and must allocate income to debt resolution rather than consumption), and they increase bank loss provisions, tightening lending standards further — the credit crunch mechanism that can amplify recessionary pressures initiated by other factors.
10. Housing Market Activity — SEVERE CONTRACTION
Existing home sales volume — the number of homes actually sold each month — sits at approximately 3.8–4.0 million annualized units as of early 2026, near the lowest levels since 2010 and approximately 30% below the 5.5–6.0 million pace of the 2021–2022 period. The mortgage lock-in effect creates a supply constraint that prevents a price collapse, but the transaction volume collapse is itself economically significant. Each home sale generates approximately $75,000–$100,000 in economic activity (moving services, furniture, appliances, repairs, realtor commissions) that is currently suppressed.
New construction permits have also declined, with single-family housing starts below the long-run demographic demand level of approximately 1.0–1.1 million units annually. The housing sector — a historically reliable recession leading indicator — has been in a technical contraction for over two years, though the price stability maintained by the lock-in effect has masked the severity of the underlying market dysfunction.
11. Corporate Earnings Guidance — DETERIORATING
S&P 500 corporate earnings expectations for full-year 2026 have been revised downward by approximately 8–10% from January 2026 projections through early April, as companies across retail, consumer discretionary, manufacturing, and advertising sectors have either guided lower or withdrawn guidance entirely due to tariff uncertainty. When earnings expectations decline at this pace, equity market volatility typically increases and corporate capital investment plans are revised downward — creating a negative feedback loop between financial market conditions and real economic activity.
12. Federal Reserve Recession Probability Models — ELEVATED
The Federal Reserve Bank of New York’s recession probability model — based on the yield curve spread — estimates the probability of recession within the next 12 months at approximately 38–42% as of April 2026. The Philadelphia Fed’s Survey of Professional Forecasters puts mean recession probability at approximately 33–35%. Goldman Sachs has raised its 12-month recession probability to 45%. While none of these estimates exceed 50% — meaning recession is not the consensus base case — probabilities in the 35–45% range represent a significant departure from the 10–15% “background” recession probability typical of non-stressed economic environments.
The April 2026 Composite Assessment
Taking all twelve indicators together: seven are in clear warning territory (LEI, yield curve re-steepening, ISM Manufacturing, consumer confidence, credit card delinquencies, housing volume, earnings guidance), three are at neutral-to-weakening levels (initial claims, services PMI, real income growth), one is moderately concerning (payrolls), and one provides quantified probability estimates in the elevated-but-not-certain range (Fed models). This is the broadest simultaneous deterioration in leading and coincident indicators since late 2007.
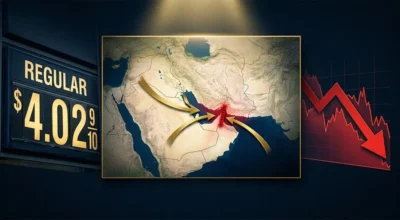
The critical uncertainty: tariff policy. The 2025–2026 tariff regime introduces supply-side inflationary pressures that create a policy dilemma for the Federal Reserve — recessions normally warrant aggressive rate cutting, but tariff-driven inflation constrains the Fed’s ability to cut without risking a new inflation surge. This stagflationary dynamic — recession risk combined with above-target inflation — is the specific scenario most challenging for monetary policy and most damaging for household finances simultaneously.
What This Means for Your Financial Decisions in April 2026
The composite indicator reading is not a prediction of certain recession — it is a probability assessment that warrants immediate precautionary action regardless of ultimate outcome. The financial preparations that make sense when recession probability elevates the same preparations that improve financial resilience regardless of economic conditions: building or reinforcing your emergency fund to a minimum of 6 months of essential expenses, reducing high-interest consumer debt aggressively before any income disruption occurs, reviewing your job security situation honestly and implementing the strategies in our job security guide, reviewing and potentially reducing discretionary spending to create a financial buffer, and ensuring your investment allocation matches your actual risk tolerance rather than the theoretical tolerance you stated during a calmer period.
The economic data available in April 2026 presents a clear picture: this is not a moment for financial complacency. Preparation is not pessimism — it is the rational response to a risk-elevated environment that every informed American household should be executing right now.
Where to Monitor These Indicators Going Forward
All of the indicators discussed in this article are publicly available from government and nonprofit sources at no cost. The BLS releases initial jobless claims every Thursday at 8:30 AM Eastern. The Conference Board releases the LEI monthly. The ISM releases Manufacturing and Services PMI on the first and third business days of each month. The Federal Reserve Bank of New York maintains its recession probability model at newyorkfed.org. Monitoring these sources monthly provides the most accurate available picture of recession risk without paying for expensive research subscriptions.

💬 0 Comments