On April 14, 2026 — the same day as the IMF and World Bank spring meetings in Washington — the International Monetary Fund released its most consequential World Economic Outlook report since the COVID pandemic. The timing was pointed: finance ministers and central bank governors from 190 member nations gathered in a city still absorbing the economic aftershocks of the Iran war, which began 45 days earlier, and the IMF met them with an analysis that was simultaneously a forecast, a warning, and a scenario document that should be read by every investor, household, and policymaker who wants to understand where the global economy is heading.
The headline is striking enough on its own: the IMF cut its global growth forecast for 2026 to 3.1% — down from 3.3% in January — and noted soberly that absent the Iran war, it would actually have upgraded its forecast by 0.1 percentage point to 3.4%, reflecting genuine economic momentum from technology investment, lower interest rates, and fiscal support. The war has not merely reduced growth; it has reversed what would have been an upgrade into a downgrade — a 0.5 percentage point swing attributable entirely to the geopolitical shock from the Strait of Hormuz closure.
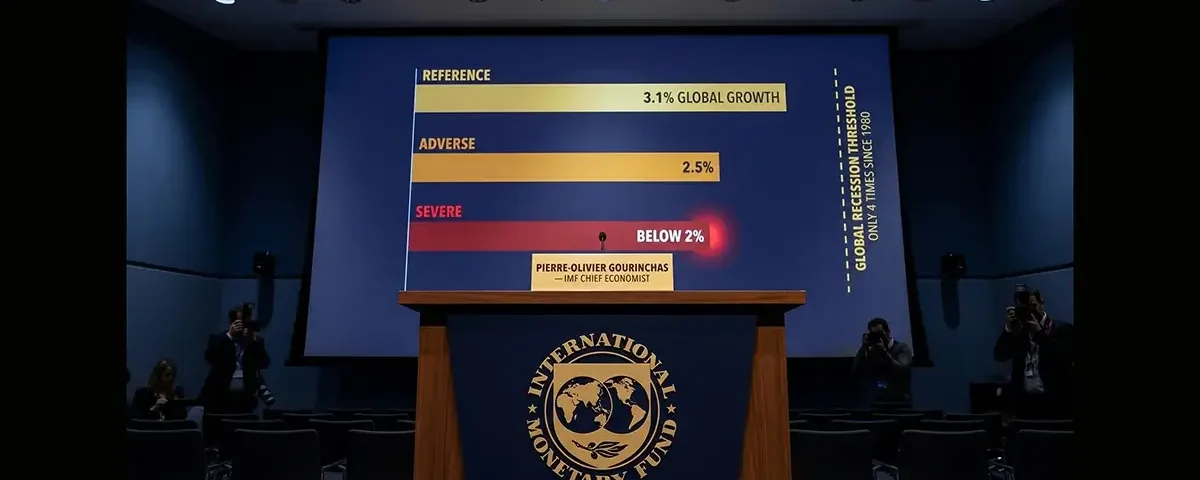
But the headline number understates the report’s real significance. The IMF’s April 2026 World Economic Outlook presented three distinct growth scenarios — reference, adverse, and severe — based on how the Iran war unfolds, and the severe scenario is what has reverberated through global financial markets since the report’s release. In the severe scenario, global growth falls below 2% in 2026 — a threshold the IMF defines as a global recession, one that has occurred only four times since 1980. Global inflation would top 6% in this scenario. Multiple countries would enter outright economic contraction. The IMF’s own Chief Economist described the Gulf situation as “potentially much, much larger” than any prior shock of recent years.
This cornerstone analysis explains everything the IMF’s April 2026 report actually says, what each scenario means, which countries and regions face the greatest risk, how the IMF defines a global recession, what history tells us about recoveries from war-driven global slowdowns, and what the three-scenario framework means practically for American households, investors, and businesses.
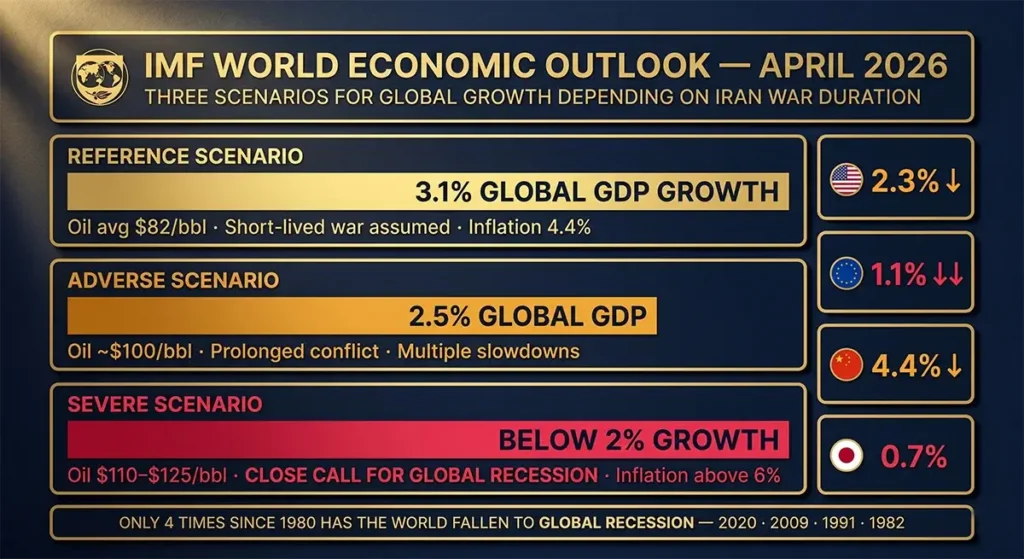
The IMF’s April 2026 World Economic Outlook warns that the Iran war and Strait of Hormuz closure have created the most serious threat to global economic stability since COVID. Three scenarios: Reference (oil $82/bbl avg) → 3.1% global growth, down from 3.3% in January. Adverse (oil ~$100/bbl) → 2.5% global growth. Severe (oil $110 in 2026, $125 in 2027) → below 2% global growth with global inflation above 6% — a “close call for global recession” that has happened only four times since 1980. IMF Chief Economist Pierre-Olivier Gourinchas: “What’s happening in the Gulf is potentially much, much larger” than any prior shock this decade.
What Is the IMF World Economic Outlook — and Why Does It Matter?
The World Economic Outlook (WEO) is the International Monetary Fund’s flagship publication, released twice annually — in April and October — with interim updates in January and July. It represents the most comprehensive, methodologically rigorous, and institutionally authoritative macroeconomic forecast available for the global economy, covering GDP growth, inflation, trade volumes, current account balances, and policy assessments for all 190 IMF member nations.
The WEO’s authority derives from several unique institutional advantages. First, the IMF has direct surveillance relationships with all member governments, including access to data and economic modeling capacity that no private institution can replicate. Second, the WEO is produced by a staff of economists applying consistent methodological standards across all countries, making cross-country comparisons genuinely meaningful in ways that aggregating private forecasts is not. Third, the WEO’s baseline forecasts serve as the reference point for government budget planning, central bank policy frameworks, and international development financing across the developing world — giving it real-world impact beyond its analytical role.
The April 2026 World Economic Outlook, released on April 14, 2026, is particularly significant because it is the first WEO to fully incorporate the economic implications of the Iran war, which began February 28, 2026, and the consequent effective closure of the Strait of Hormuz — through which approximately 20% of global oil supply and virtually all of Qatar’s LNG exports normally transit. Prior to this report, the IMF’s January 2026 WEO Update had forecast oil prices declining to approximately $62/barrel in 2026 and had projected global growth at 3.3%. Both assumptions have been overtaken by events.
The Three Scenarios: Reference, Adverse, and Severe — A Complete Breakdown
Rather than presenting a single central forecast — which would have been misleading given the extraordinary uncertainty about the war’s duration and resolution — the IMF’s April 2026 WEO presented three explicit growth scenarios. This three-scenario structure is itself a signal: the IMF is communicating that the range of plausible outcomes is too wide to responsibly compress into a single number, and that policymakers must plan across the entire scenario range rather than anchor to any central forecast.
Scenario 1 — Reference Scenario: Rapid Resolution, Moderate Damage
The reference scenario is the IMF’s most optimistic plausible outcome — not a best case, but the scenario that serves as the formal baseline for the WEO’s country and regional growth forecasts. It assumes a short-lived Iran war, with the conflict resolving in the near term and energy production and exports from the Middle East beginning to normalize by mid-2026.
Under the reference scenario: global GDP growth in 2026 falls to 3.1%, down 0.2 percentage points from the January 2026 WEO forecast of 3.3%. Oil prices average approximately $82 per barrel for all of 2026 — a decline from April’s $100+ Brent levels, reflecting the assumed normalization of Hormuz traffic. Global inflation reaches approximately 4.4% for 2026. The IMF noted explicitly that absent the war, it would have upgraded its forecast by 0.1 percentage point to 3.4%, so the war’s net effect relative to the pre-war trajectory is a 0.3 percentage point downgrade, not merely 0.2.
Country-level reference scenario projections:
| Economy | 2026 Growth (Reference) | Change from Jan 2026 | Key Driver |
|---|---|---|---|
| United States | 2.3% | −0.1pp | Tax cuts + AI investment offset higher energy costs |
| China | 4.4% | −0.1pp | Energy cost headwinds offset by lower US tariffs + stimulus |
| Euro Zone | 1.1% | −0.2pp | Higher energy prices compounding prior Russia war exposure |
| Japan | 0.7% | Largely unchanged | Energy import dependence; BoJ rate hike pace slightly faster |
| India | 6.3% | Unchanged from Jan | Strong domestic demand; energy import diversification |
| Global (Advanced) | ~1.8% | −0.2pp | Energy costs + fiscal consolidation |
| Global (Emerging) | ~4.2% | −0.1pp | Heterogeneous: Gulf states deteriorate; others more resilient |
Even the reference scenario contains a stark warning about the Middle East and Central Asian oil-exporting nations: “Oil exporting nations in the Gulf are likely to see a sharp slowdown in economic growth or even a contraction this year” under this most optimistic scenario. Countries in the region face the paradox of being energy exporters whose production has been curtailed by the Hormuz closure — earning less oil revenue precisely when their domestic economies most need fiscal resources to manage the conflict’s costs.
Scenario 2 — Adverse Scenario: Prolonged Conflict, Sustained High Oil
The adverse scenario models a longer conflict that prevents Hormuz from reopening fully, keeping oil prices elevated at approximately $100 per barrel for all of 2026, with some moderation to $75/barrel in 2027 as the market adapts through alternative supply routes and demand destruction.
Under the adverse scenario: global GDP growth falls to 2.5% in 2026 — a more severe slowdown that brings multiple advanced economies to stall speed and pushes several emerging markets into contraction. The 2.5% figure is significant because it is below the pre-pandemic global growth average of approximately 3.5% by a full percentage point, representing a meaningful global demand shortfall with distributional consequences that would fall most heavily on developing economies dependent on energy imports.
IMF Chief Economist Pierre-Olivier Gourinchas was explicit about the severity of this scenario in his Reuters interview: “What’s happening in the Gulf is potentially much, much larger” than President Trump’s initial wave of steep tariffs — which had themselves represented significant economic disruption in 2025. The comparison is striking: the tariff shock of 2025, which commanded extraordinary market attention and policy response, is characterized as smaller than what the IMF’s adverse war scenario entails.
The adverse scenario’s 2.5% global growth rate sits above the technical recession threshold of below 2% but close enough that any additional shock — a financial market dislocation, a major sovereign debt crisis, a second geopolitical flashpoint — could push the global economy into recession without requiring the full severe scenario to materialize.
Scenario 3 — Severe Scenario: A “Close Call for Global Recession”
The severe scenario is the IMF’s documented worst-case pathway — not a tail risk but a plausible outcome the institution felt compelled to model and publish. It assumes oil prices averaging $110 per barrel in 2026 and escalating further to $125 per barrel in 2027, reflecting a prolonged Hormuz closure or active expansion of the conflict that damages critical energy infrastructure across the Gulf region.
Under the severe scenario: global GDP growth falls below 2% in 2026. Global inflation tops 6%. Gourinchas stated directly that “a number of countries would be in outright recessions under this scenario.” The IMF’s report characterized this outcome as “a close call for a global recession which has happened only four times since 1980” — the most recent being the COVID pandemic of 2020, preceded by the 2008–09 global financial crisis, the 2001 dot-com/September 11 slowdown, and the 1982 Volcker-era recession.
The severe scenario also introduces a critical and underappreciated risk: oil prices at $110–$125/barrel for an extended period would increase expectations of persistent inflation, potentially triggering second-round wage and price effects that make the inflation self-sustaining well beyond the energy shock itself. This is precisely the mechanism that turned the 1973 and 1979 oil shocks into the sustained stagflation of the late 1970s and early 1980s — the most damaging peacetime economic episode in modern history.
An independent assessment from Macquarie Group noted that if the ceasefire fails to hold and hostilities continue into June, oil has a 40% chance of reaching $200 per barrel — a level that would exceed even the IMF’s severe scenario assumptions and produce economic damage that has no modern peacetime precedent.
What Is a Global Recession? The IMF’s Definition and Why Below 2% Matters
The term “global recession” is frequently misused in economic commentary, making it essential to understand precisely what the IMF means when it characterizes sub-2% global growth as a “close call for global recession.” The definition is not analogous to a national recession (two consecutive quarters of negative GDP growth) because global growth aggregates countries of vastly different sizes, growth trajectories, and economic structures — making it mathematically unlikely for the global aggregate to turn negative even in severe downturns.
The IMF defines a global recession as a period in which global per capita GDP growth is negative — which, given population growth of approximately 0.8% annually, requires aggregate global GDP growth to fall below approximately 0.8%. However, in practice, the IMF and most economists use a working threshold of approximately 2% global growth as the “recession-equivalent” level, because at that rate: many individual countries are in actual recession, global trade volumes contract, commodity prices fall sharply, capital flows to developing countries reverse, global unemployment rises measurably, and the self-reinforcing mechanisms of financial deleveraging and business investment contraction that define national recessions operate at the global level.
The four global recessions since 1980 provide the essential context:
| Episode | Global GDP Growth | Primary Cause | Duration | Recovery Profile |
|---|---|---|---|---|
| 1982 | ~0.9% | Volcker rate hikes; debt crisis in Latin America | 12–18 months | Moderate; led by US recovery |
| 1991 | ~1.4% | Gulf War oil shock; savings & loan crisis | 8–12 months | Gradual; uneven by region |
| 2009 | −1.7% | Global financial crisis; credit system collapse | 18–24 months | Slow; fiscal austerity constrained recovery |
| 2020 | −3.1% | COVID-19 pandemic; global lockdowns | 2–4 quarters | Fast; unprecedented fiscal stimulus |
| 2026 Severe Scenario | Below 2% | Iran war oil shock; Hormuz closure | TBD | Depends on conflict resolution |
The severe scenario’s below-2% growth would place 2026 in the same historical category as these episodes — slower than 1991 (which was itself a Gulf War oil shock episode and therefore the most directly analogous historical comparison) and approaching the threshold at which global economic dynamics become self-reinforcing in ways that make recovery dependent on explicit policy intervention.
The IMF’s Regional Picture: Who Gets Hit Hardest
The IMF’s April 2026 WEO does not distribute the economic pain evenly — the report shows clearly which regions and economies are most exposed to the Iran war shock and which have meaningful insulation.
Most Exposed: The Middle East, Gulf States, and Central Asia
The most severe economic damage in all three scenarios falls on the countries closest to the conflict — the Gulf Cooperation Council states (Saudi Arabia, UAE, Kuwait, Qatar, Bahrain, Oman) and Iraq, as well as Iran itself. These economies face the paradox described earlier: they are energy exporters whose export capacity has been physically curtailed by the Hormuz closure. Their sovereign wealth funds and fiscal buffers provide short-term insulation, but the IMF notes that “oil exporting nations in the Gulf are likely to see a sharp slowdown in economic growth or even a contraction” even in the reference (most optimistic) scenario.
Significantly Exposed: Europe and Japan
The euro zone has received one of the largest growth downgrades in the report — 0.2 percentage points for both 2026 and 2027, taking projected growth to just 1.1% in 2026 and 1.2% in 2027. The IMF specifically notes that Europe is “still struggling with higher energy prices caused by Russia’s 2022 invasion of Ukraine” and is therefore particularly vulnerable to a second consecutive energy shock from the Iran war. Germany and Italy — the eurozone’s most energy-dependent large manufacturers — face heightened recession risk that the ECB has acknowledged directly, warning that a prolonged conflict could trigger stagflation and push major energy-dependent economies into technical recession by end-2026.
Japan, at 0.7% growth for 2026, is the weakest projected performer among major advanced economies in the reference scenario — and Japan has among the highest oil import dependency of any G7 nation, with approximately 80% of its oil imports historically transiting the Strait of Hormuz. The Bank of Japan is expected to hike rates at a slightly faster pace than previously anticipated — a potentially problematic combination of energy-driven inflation and tightening monetary policy for an economy already at near-zero growth.
Moderately Exposed: The United States
The United States receives a more modest downgrade — just 0.1 percentage point — to 2.3% growth for 2026. The relative resilience reflects several genuine US advantages: the US is a major domestic oil producer (approximately 13.6 million barrels per day), providing meaningful insulation from Gulf import disruption; the continued AI and technology investment boom is supporting productivity and business investment; tax cut effects are providing fiscal stimulus; and the dollar’s reserve currency status provides financial system buffers unavailable to other economies.
However, even the US 2.3% growth figure represents meaningful deceleration from the January 2026 forecast of 2.4%, and the IMF noted that 2027 growth is forecast at 2.1% — reflecting the lagged effects of sustained high energy costs working through the economy. Under the adverse or severe scenarios, US growth would fall materially further — with Goldman Sachs independently placing 12-month US recession probability at 30% and Moody’s Analytics at 49%, figures that correspond more closely to the IMF’s adverse and severe scenarios than to the reference baseline.
Most Resilient: India and Selective Emerging Markets
India’s 6.3% growth projection is unchanged from January — reflecting the strength of India’s domestic demand, its more diversified energy import sources, and the continuing structural momentum of its manufacturing and services expansion. India’s relative resilience in a global energy shock is meaningful: it demonstrates that the IMF’s scenario is not uniformly catastrophic for the entire developing world, but rather sharply differentiated between oil-importing economies with strong domestic fundamentals and those dependent on Gulf energy flows or commodity export revenues.
The IMF’s Inflation Warning: Above 6% in the Severe Scenario
The inflation projections embedded in the IMF’s April 2026 scenarios deserve as much attention as the growth figures. Global inflation topping 6% in the severe scenario — compared to 4.4% in the reference scenario — represents the potential return of an inflationary environment that the global economy spent 2022–2025 arduously unwinding from the post-COVID peak.
The 6% severe scenario figure is particularly alarming because it implies a second wave of inflation arriving on top of already-elevated price levels in most economies. The US entered 2026 with CPI at 2.4% — above the Fed’s 2% target but significantly below crisis levels. The March 2026 CPI reading of 3.3% (the first to capture Iran war effects) already shows the trajectory toward the reference scenario’s 4.4% global average. If oil reaches $110–$125/barrel, OECD’s projected US CPI of 4.2% would be surpassed, and the IMF’s severe scenario 6%+ global inflation would represent US inflation potentially reaching 5–7% — levels not seen since the peak of the post-COVID surge in 2022.
For central banks, the inflation projection creates the same dilemma that defines warflation environments: the supply-driven nature of the price shock means that rate hikes, while they may be necessary to prevent second-round inflation expectations from becoming entrenched, cannot address the root cause (Gulf energy supply disruption) and actively harm the growth side of the equation. The IMF’s report implicitly acknowledges this by noting that interest rate reductions “were expected to be postponed or conversely increased in light of higher inflation caused by supply shortages and speculation.”
The IMF’s Special Finding: War Leaves Lasting Economic Scars
Beyond the three growth scenarios, the April 2026 WEO included a significant analytical chapter on the macroeconomics of conflict — a direct response to the Iran war — that reaches conclusions with sobering implications for the recovery timeline regardless of how quickly the conflict resolves.
The IMF’s analysis of post-World War II conflicts found that wars “generate large and persistent output losses in economies where fighting occurs — exceeding those from financial crises or severe natural disasters — alongside nonnegligible spillovers to other countries.” The report specifically documented that “economic recoveries are slow and uneven, depending critically on sustained peace. Even when peace holds, recoveries remain modest relative to wartime losses, led primarily by labor, while capital and productivity stay subdued.”
This finding matters enormously for calibrating expectations about the recovery from the current episode. Even optimistic scenario resolution — ceasefire holds, Hormuz reopens, oil prices normalize — does not produce an immediate economic rebound to pre-war growth trajectories. Infrastructure damaged by the conflict requires sustained investment to rebuild. Insurance and operational cost premiums for Gulf shipping take time to normalize after the threat recedes. Business investment decisions deferred during the uncertainty period take quarters to reverse. Supply chain diversification investments undertaken in response to the Hormuz closure create permanent cost-structure changes that do not disappear when the closure ends.
The defense spending dimension compounds this. The IMF found that “large defense spending booms have become more frequent” and that in a typical boom, defense outlays increase by about 2.7 percentage points of GDP over two-and-a-half years, with roughly two-thirds financed through deficit. “Fiscal deficits worsen by about 2.6 percentage points of GDP, public debt increases by about 7 percentage points within three years, and external balances deteriorate.” Countries that increase defense spending to respond to the war’s geopolitical signal — which many NATO members and regional powers are already doing — face this fiscal deterioration trajectory on top of the direct economic damage from the war itself.
What the IMF’s Warning Means for the United States Specifically
For American readers, the IMF’s three-scenario framework translates into concrete domestic economic implications that are worth examining at the household and business level.
In the reference scenario — the IMF’s working baseline — the US grows at 2.3% in 2026, inflation gradually rises toward 4%+, the Federal Reserve holds rates at current levels before cutting cautiously in late 2026, and the labor market softens modestly but avoids outright recession. This is an uncomfortable environment with meaningfully higher living costs, slower hiring, and constrained real income growth — but not a recession by standard definitions. The Sahm Rule stays below its 0.50 trigger. Goldman Sachs’s and Moody’s recession probability estimates at 30% and 49% respectively correspond to risks within this reference scenario range.
In the adverse scenario — sustained $100 oil and a prolonged Hormuz restriction — the US faces a more significant economic slowdown, with growth potentially dropping toward 1.5–2.0% and recession probability rising above 50%. The Sahm Rule could trigger in this scenario if Goldman’s projected 4.6% unemployment materializes. The Federal Reserve faces a genuine stagflation trap: CPI approaching 5%, growth at stall speed, and no tool that addresses both simultaneously.
In the severe scenario — $110–$125 oil and a two-year conflict extension — the US would likely enter technical recession, with GDP growth turning negative for one or more quarters. Historical precedent from the 1973 and 1980 oil shock episodes suggests unemployment could rise to 6–8% range before the cycle bottoms. The Fed’s response — rate hikes or holds despite recession — would replicate the Volcker dilemma, with the resolution taking years rather than quarters.
How Other Major International Institutions Compare to the IMF Warning
The IMF’s April 2026 warning is not an outlier — it sits within a constellation of institutional assessments that all point in the same direction, varying primarily in the degree of alarm rather than the direction of risk.
The World Bank’s June 2022 analysis of the Russia-Ukraine war — now directly applicable to the current Iran war context — warned of “a protracted period of feeble growth and elevated inflation, raising the risk of stagflation with potentially harmful consequences for middle- and low-income economies alike.” The World Bank’s current assessments of the 2026 crisis use the same stagflation risk framework, noting that the 2026 disruption is larger in scale than 2022.
The OECD projects US CPI averaging 4.2% for full-year 2026 and has characterized the Iran war as “testing the resilience of the global economy.” The OECD’s separate country-level recession probability assessments for the UK and Germany are significantly elevated — consistent with the IMF’s finding that Europe is most immediately exposed among the major advanced economy blocs.
The Chatham House analysis, published March 11, 2026, provided the most nuanced assessment of the scenario range: if the conflict resolves quickly and energy production normalizes by mid-year, “global inflation in Europe and Asia would likely be only around 0.5 percentage points higher than pre-conflict forecasts” — consistent with the IMF’s reference scenario. Under prolonged conflict, Chatham House’s own analysts project severe stagflation and outright recession in multiple European economies.
The consistent theme across the IMF, World Bank, OECD, and Chatham House assessments is that the war’s economic consequences are entirely within the range of manageable outcomes if resolved quickly, and entirely within the range of historically unprecedented peacetime damage if prolonged.
What Investors and Households Should Take From the IMF’s Three Scenarios
The IMF’s explicit three-scenario framework is unusual — it represents the institution communicating not one forecast but a range of outcomes that it considers all plausible. This is both intellectually honest and practically useful, because it allows individuals to calibrate their own assessments and actions against a professionally constructed range rather than a single central prediction.
For investors: The IMF’s three scenarios imply meaningfully different asset allocation implications. In the reference scenario, equity markets recover as the conflict resolves and growth, while slower, remains positive. In the adverse scenario, defensive positioning — energy equities (benefiting from sustained high oil), gold, short-duration bonds — outperforms cyclical assets. In the severe scenario, capital preservation takes priority over return maximization, with cash, short Treasuries, and commodity exposure providing the best risk-adjusted performance relative to equities and credit. The probability-weighted optimal portfolio at this moment — given the IMF’s own implied probability distribution across the three scenarios — is meaningfully more defensive than pre-war positioning.
For households: The IMF’s warning is the most authoritative institutional confirmation that the economic uncertainty of 2026 is genuine and multi-scenario, not a temporary blip that will resolve in weeks. The practical implications mirror what the Sahm Rule trigger analysis and warflation analysis suggest independently: build emergency reserves, review variable-rate debt exposure, budget for sustained elevated energy and food costs, defer major discretionary commitments, and assess employment situation relative to sector-level exposure to the adverse and severe scenario pathways (energy-intensive manufacturing and consumer discretionary being most vulnerable; healthcare, utilities, and government-contracted services being most resilient).
For businesses: The IMF’s scenario framework is a planning tool, not a forecast. Companies that build contingency plans for both the reference and adverse scenarios — adjusting supply chains, hedging energy costs, stress-testing revenue forecasts under 2.5% and sub-2% global growth — are better positioned than those that anchor to the most optimistic reference baseline and make irreversible commitments accordingly. The IMF has provided the roadmap; the management teams that use it are the ones that will emerge from the uncertainty period structurally stronger.
💬 0 Comments