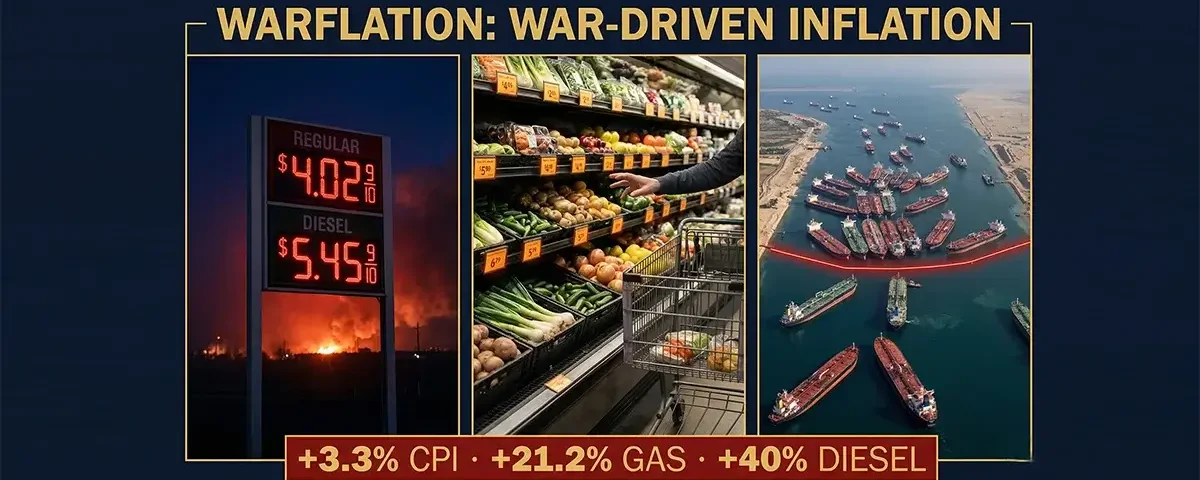
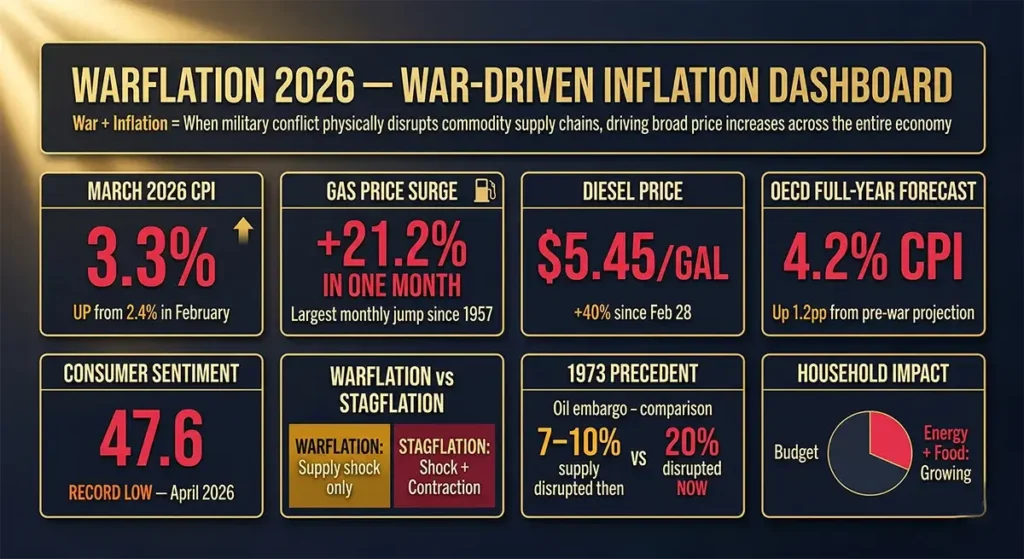
On April 10, 2026, the Bureau of Labor Statistics released the first Consumer Price Index report to fully capture the economic consequences of the US-Israeli war against Iran. The headline number — 3.3% year-over-year inflation in March, up sharply from 2.4% in February — was striking enough. But the monthly figure was more alarming: prices rose 0.9% in a single month, the largest one-month increase in nearly four years. Energy costs surged 10.9%. Gasoline alone jumped 21.2% in the month of March. Airfares rose 14.9% over the prior year. The Associated Press described it as “the largest monthly jump in gas prices in six decades.” Oxford Economics’ Andrew Pearce warned: “It’s going to get more painful in April.”
What Americans are experiencing right now has a name that economists, policymakers, and financial analysts are increasingly reaching for: warflation. The term combines “war” and “inflation” to describe the specific, historically recurring phenomenon of military conflict driving consumer price surges through supply disruption, uncertainty premiums, infrastructure damage, and the cascade of war costs through the energy and food systems. It is distinct from ordinary inflation (driven by excess demand or money supply expansion), from stagflation (the broader condition of high inflation with stagnant growth), and from simple cost-push inflation (rising input costs from any source). Warflation is inflation with a specific originating cause — armed conflict — and a specific transmission mechanism — disruption to the critical supply chains that keep modern economies running.
Warflation is not a new phenomenon — it has driven every major inflation crisis of the past 80 years, from the Korean War price surge of the early 1950s through the 1973 oil embargo, the 1979 Iranian Revolution, the 1990 Gulf War, and the 2022 Russia-Ukraine energy shock. What distinguishes the 2026 Iran war warflation from its predecessors is its simultaneous impact across five transmission channels — oil, natural gas, fertilizer, industrial commodities, and maritime supply chains — at a scale that the IEA has described as “the largest supply disruption in the history of the global oil market.” The OECD now projects US inflation at 4.2% for 2026 — 1.2 percentage points above its pre-war forecast. The Federal Reserve is frozen between fighting inflation and preventing recession. Understanding warflation — its mechanisms, its history, and its specific 2026 manifestation — is the essential framework for every financial decision American households face in the months ahead.
What Is Warflation? Definition, Origin, and Distinction From Other Inflation Types
Warflation is a portmanteau term combining “war” and “inflation” that describes the inflationary pressures specifically caused or amplified by military conflict and associated geopolitical disruption. While the term does not yet appear in major economic dictionaries — reflecting its relatively recent emergence in economic journalism rather than academic literature — it captures a distinct and historically important inflationary mechanism that mainstream economic vocabulary has not always clearly separated from other inflation types.
To understand what makes warflation distinctive, it helps to locate it within the broader taxonomy of inflation:
Demand-pull inflation occurs when aggregate demand in an economy exceeds the economy’s productive capacity — too many dollars chasing too few goods. The post-COVID consumer spending surge of 2021–2022, fueled by stimulus payments and pent-up demand, was a classic demand-pull inflation episode. This type can be addressed by the Federal Reserve raising interest rates to reduce borrowing and spending.
Cost-push inflation occurs when the costs of producing goods and services rise — through higher wages, more expensive raw materials, or supply chain disruptions — and producers pass those costs through to consumers. Warflation is a specific and particularly severe form of cost-push inflation, driven by the wartime destruction or blockade of critical production and transportation infrastructure.
Monetary inflation occurs when the money supply grows faster than the economy’s real productive output — the classic “too much money chasing too few goods” scenario associated with extreme government money-printing in wartime financing. Historical wartime inflations in Germany after World War I and in numerous developing economies involved this channel as well.
Warflation combines elements of cost-push inflation (through supply disruption) with a unique additional dimension: the uncertainty premium. Even commodities whose physical supply is not directly disrupted by a conflict see price increases because financial markets price in the risk of future supply disruption — a geopolitical risk premium that can add $10–$30 per barrel to oil prices even when actual production is unchanged. This forward-looking market behavior means warflation begins the moment a conflict starts, often before any physical supply disruption has materialized, and can persist for months or years after the immediate conflict has resolved as supply chains restructure around the new geopolitical reality.
The term gained particular currency during and after Russia’s 2022 invasion of Ukraine, when energy and food commodity prices surged across Europe and the United States — driven by a conflict in which neither combatant was a direct trading partner of the United States but whose disruption of gas pipelines, grain exports, and fertilizer production transmitted inflation globally. The 2026 Iran war has produced a warflation episode of considerably greater magnitude, given the Strait of Hormuz’s centrality to global energy flows compared to any single commodity disrupted by the Russia-Ukraine conflict.
The Five Transmission Channels of 2026 Warflation
The warflation generated by the 2026 Iran war does not operate through a single channel. It is transmitting into the US and global economies through five simultaneous pathways, each of which would be significant in isolation and which compound each other in combination.
Channel 1: The Oil Price Shock
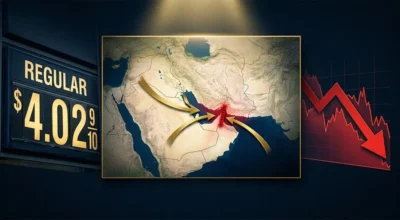
The most direct and most immediate transmission channel of 2026 warflation is the oil price surge driven by the effective closure of the Strait of Hormuz since March 4, 2026. Brent crude — the international oil benchmark — stood at approximately $70–$80 per barrel before the conflict began on February 28. It spiked to $118 per barrel by the end of March 2026 before declining somewhat to approximately $96 as of the first week of April, following the announcement of a fragile ceasefire on April 8. The IEA’s characterization of the situation as “the greatest global energy security challenge in history” and “the largest supply disruption in the history of the global oil market” — surpassing both the 1973 Arab oil embargo and the 1979 Iranian Revolution in the percentage of global supply disrupted — establishes the unprecedented scale of this channel.
Oil is not merely a fuel — it is the feedstock and energy source for modern manufacturing, agriculture, transportation, and chemical production. When oil prices rise 50–70% in five weeks, the price increase does not stay contained in the gasoline sector. It propagates through every supply chain in which petroleum products are an input: plastics, synthetic fibers, pharmaceuticals, fertilizers, asphalt, lubricants, and dozens of other industrial categories all feel the cost pressure almost immediately. The March 2026 CPI report confirmed this: energy costs rose 10.9% in a single month, with gasoline jumping 21.2%. The BLS energy index’s March surge was described by economists as the “first read on inflation to capture the effects of the Iran war” — and April’s CPI reading, which will capture the full month of elevated prices after the ceasefire’s partial effects, is widely expected to show further acceleration.
Channel 2: Natural Gas and the LNG Disruption
The Strait of Hormuz crisis did not only disrupt oil. Qatar — the world’s largest liquefied natural gas exporter — transits virtually all of its LNG exports through Hormuz. QatarEnergy declared force majeure on all LNG exports shortly after the Strait’s effective closure, creating a simultaneous natural gas supply shock alongside the oil shock. In the United States, which is now a net LNG exporter and has largely insulated its domestic gas market from direct Gulf dependence, the transmission of this channel is less acute than in Europe and Asia. However, higher global LNG prices reduce the comparative cost advantage of US LNG exports, affect US energy company revenue streams, and contribute to elevated electricity prices in markets with gas-fired power generation.
The European dimension of this channel is more severe. European gas storage levels entering the crisis were approximately 30% of capacity — critically low following a harsh 2025–2026 winter — and Dutch TTF gas benchmarks nearly doubled to over €60 per megawatt-hour by mid-March. The European Central Bank postponed planned interest rate cuts on March 19 in response. UK inflation, already running at 3%, is now expected to breach 5% in 2026 — a direct warflation consequence that is shaping monetary policy decisions thousands of miles from the Strait of Hormuz.
Channel 3: Fertilizer and the Food Price Time Bomb
The most economically consequential but least immediately visible warflation channel in 2026 is the disruption to global fertilizer supply. The Persian Gulf accounts for approximately one-third of global urea production and one-quarter of global ammonia supply — both essential nitrogen fertilizers for agricultural production worldwide. This regional concentration exists because natural gas, which is 70–90% of ammonia production costs, is exceptionally cheap and abundant in the Gulf. The Strait of Hormuz closure disrupts not only fertilizer exports but also the natural gas feedstock that Gulf fertilizer plants require for their own operations.
Fertilizer price spikes do not immediately show up in grocery store prices — they show up in spring planting season input costs, which translate to harvest-time food prices, which appear in CPI data 6–9 months after the initial supply disruption. The spring 2026 planting season across the Northern Hemisphere is occurring precisely during the 2026 Strait crisis — meaning the food price warflation from this channel is not visible in March or April CPI data but will materialize in fall 2026 and through 2027. The US Energy Information Administration’s chokepoint analysis documents how dependent global agriculture is on Gulf-region commodity flows, a dependency that extends far beyond direct energy consumption.
Channel 4: Aviation and Transportation Costs
Jet fuel is a refined petroleum product, and when Brent crude spikes from $70 to $118 per barrel, the cost of jet fuel more than doubles. The March 2026 CPI data confirmed the transmission: airfares rose 14.9% over the prior 12 months, with the bulk of that increase concentrated in the single month of March. Airlines have responded with a combination of price increases, fuel surcharges, capacity cuts, and route suspensions. The global airline industry had projected record profits of $41 billion for 2026 before the conflict — those projections have been rendered meaningless. Before the war, an economy class round-trip from the US to Rome cost approximately $846; by late March, the same ticket cost $1,165.
Beyond aviation, the broader transportation cost surge transmits warflation through every sector of the goods economy. Trucking diesel costs have risen 40%+ since late February. Construction equipment fuel costs are elevated. Shipping freight rates — already disrupted by Houthi Red Sea attacks through most of 2024 and 2025 — face additional pressure as tanker routes are forced to reroute around Africa’s Cape of Good Hope, adding 10–14 days and thousands of additional nautical miles per voyage. Every additional fuel cost in the transportation system adds to the final retail price of every good that moves through it.
Channel 5: Industrial Commodity and Manufacturing Input Disruption
The Gulf region supplies not only energy but also critical industrial commodities — aluminum (UAE is a major producer), aluminum feedstock (bauxite processing powered by cheap Gulf gas), petrochemicals, and helium (Qatar). Chemical manufacturers across the UK and EU have imposed surcharges of up to 30% on customers to offset surging feedstock and energy costs. Steel manufacturers face similar pressures. These industrial cost increases take weeks to months to transmit through supply chains to consumer goods — the delayed warflation that Oxford Economics characterized as a “short, sharp shock” whose full consumer price impact will materialize over the next two to three months.
The March 2026 CPI Report: Warflation’s First Official Measurement
The Bureau of Labor Statistics March 2026 CPI report — released April 10, 2026 — represents the first systematic, government-confirmed measurement of 2026 warflation’s impact on American consumer prices. The headline numbers: consumer prices rose 3.3% year-over-year in March, up from 2.4% in February, and rose 0.9% on a monthly basis — the largest single-month increase in nearly four years.
The sectoral breakdown of the March 2026 CPI tells the warflation story with precision:
| CPI Category | Monthly Change (Mar 2026) | Annual Change (Mar 2026) | Warflation Channel |
|---|---|---|---|
| Overall CPI | +0.9% | +3.3% | Combined all channels |
| Energy Index | +10.9% | +14.2% (est.) | Oil price shock — Channel 1 |
| Gasoline | +21.2% | +25.4% (est.) | Oil refining chain — Channel 1 |
| Airfares | Elevated | +14.9% | Jet fuel surge — Channel 4 |
| Food (early signal) | +0.4% | +3.1% | Transport costs — Channel 4; fertilizer lag — Channel 3 |
| Core CPI (ex. food/energy) | +0.3% | +3.0% | Second-round transmission beginning |
The fact that core CPI (excluding food and energy) also moved higher in March — to 3.0% annual — is the reading that concerns the Federal Reserve most. When warflation begins appearing in core inflation, it signals that energy price increases are starting to transmit through the broader economy into wages, rents, and services pricing — the “second-round effects” that the Fed specifically flagged as its primary concern in its March 18 decision to hold rates unchanged. Once second-round effects become embedded in wage and price-setting behavior, warflation becomes significantly harder to control without aggressive monetary tightening that would further damage growth.
The History of Warflation: Every Major Episode Since the Korean War
Warflation is not an invention of 2026 — it is an ancient economic phenomenon with a modern industrial-economy manifestation that has recurred in every decade since World War II. Understanding each historical episode illuminates the specific mechanisms through which conflict-driven inflation operates and how long its effects typically persist.
The Korean War Warflation (1950–1951)
The United States entered the Korean War in June 1950 with an economy still rebuilding from World War II rationing. US CPI rose from 1.3% in June 1950 to 8.8% by March 1951 — a more than sixfold increase in less than a year — driven by a combination of direct war expenditure (increasing government demand for steel, rubber, petroleum, and manufacturing capacity), panic buying by consumers and businesses anticipating further supply shortages, and the psychological wartime uncertainty premium. The Korean War warflation was controlled by a combination of the Defense Production Act (imposing direct price and wage controls), Federal Reserve credit restrictions, and ultimately by the conflict’s limited geographic scope preventing the oil supply disruption that would characterize later warflation episodes.
The 1973 Arab Oil Embargo Warflation
The most instructive historical parallel to 2026 warflation is the 1973 Arab oil embargo, triggered by Arab OPEC members’ response to US military support for Israel during the Yom Kippur War. The embargo disrupted approximately 7–10% of global oil supply — significantly less than the 2026 Hormuz closure’s 20% — yet produced US CPI inflation peaking at 12.3% by 1974 and contributed to a severe recession. The mechanisms were identical to 2026: oil supply shock → gasoline price surge → transportation cost surge → food price surge (through fertilizer and distribution costs) → second-round wage and price increases embedding warflation into the broader economy.
The 1973 episode produced the defining policy mistake that still haunts central bankers today: the Federal Reserve’s failure to consistently fight inflation out of concern for recession risk produced a decade of stagflation that required Paul Volcker’s economically devastating 20% interest rates in 1980–1981 to finally break. The lesson drawn from 1973 is that warflation tolerated in its early stages becomes entrenched warflation that is far more costly to resolve than it would have been to prevent. The Federal Reserve’s current approach — holding rates amid the 2026 energy shock rather than cutting — reflects this historical lesson directly.
The 1979 Iranian Revolution Warflation
Iran’s 1979 Islamic Revolution disrupted approximately 10–15% of global oil supply, driving Brent crude from approximately $13 per barrel in 1978 to a peak of $35 per barrel by 1980 — a nearly threefold increase. US CPI reached 13.5% by 1979, the highest peacetime inflation in modern American history at that point. This warflation episode, following so closely on the 1973 episode, produced the stagflation decade that defined the 1970s economic experience: stagnant real wage growth, rising unemployment, and persistent double-digit inflation that no conventional policy tool was able to control until Volcker’s shock therapy in 1980.
The 1990 Gulf War Warflation
Iraq’s invasion of Kuwait in August 1990 and the subsequent US-led Coalition military response triggered a warflation episode that, by historical standards, was relatively contained and short-lived. Oil prices spiked from approximately $15 per barrel pre-invasion to $40 per barrel at the peak in October 1990 — a 167% increase — before declining rapidly as Coalition military success became apparent and Saudi Arabia increased production to offset the Kuwaiti supply disruption. US CPI peaked at approximately 6.3% in late 1990 before declining through 1991. The 1990 Gulf War warflation contributed to a mild US recession (July 1990 – March 1991) but was contained primarily because the military resolution was rapid, oil prices normalized quickly, and the US economy entered the episode from a position of greater resilience than the 1970s.
The 2022 Russia-Ukraine War Warflation
The February 2022 Russian invasion of Ukraine produced the most recent pre-2026 warflation episode affecting the United States, European Union, and global economy. Russia’s role as the world’s largest natural gas exporter and a major oil and wheat exporter meant the conflict and subsequent Western sanctions produced a profound commodity supply shock. European natural gas prices rose by more than 400% in 2022 at their peak. US CPI reached 9.1% in June 2022 — the highest since 1981. Bureau of Labor Statistics data confirmed energy’s dominant role: the energy component of CPI rose 41.6% in June 2022 year-over-year, driven primarily by warflation from Russia’s disruption of European energy markets. The Federal Reserve responded with its fastest rate-hiking cycle since the 1970s — raising rates 11 times between March 2022 and July 2023 — eventually bringing CPI back toward 2% by late 2024. The 2022 warflation episode was ultimately more severe in Europe than in the United States, reflecting the continent’s greater gas import dependence from Russia.
Warflation vs Stagflation: Understanding the Relationship
Warflation and stagflation are related but distinct concepts that are frequently confused in economic commentary. Understanding their relationship is essential for accurately characterizing the 2026 economic situation.
Stagflation is a broader economic condition characterized by three simultaneous features: high inflation, stagnant or negative economic growth, and elevated unemployment. The term was popularized by British politician Iain Macleod in the 1960s and became associated primarily with the 1970s oil shock decade in the United States. Stagflation is the outcome — the economic condition that results when supply-side price shocks are severe enough and sustained enough to simultaneously generate inflation and economic contraction.
Warflation is a cause — a specific mechanism through which supply-side inflation is generated by military conflict. Warflation can produce stagflation if it is severe enough and sustained long enough to simultaneously raise prices and reduce economic activity. Not all warflation produces stagflation: the 1990 Gulf War produced mild warflation and a mild recession but not genuine sustained stagflation, because the military resolution was rapid enough to prevent the inflation from embedding in wage and price expectations. By contrast, the 1973 oil embargo warflation did produce stagflation because the supply disruption was sustained long enough for inflation to become entrenched.
In 2026, the current trajectory represents warflation that is at risk of becoming stagflation if the conflict and Strait of Hormuz disruption persists through the summer. The warning signs are specific: March 2026 CPI of 3.3% — rising; OECD forecast of 4.2% for the full year; second-round effects appearing in core CPI; Q4 2025 GDP at only 0.7% annualized; Goldman Sachs projecting recession probability at 30% and growth at “stall speed.” The Brookings Institution review of warflation history shows a consistent pattern: warflation that lasts longer than two to three months begins embedding in wage and price expectations, making stagflation increasingly likely regardless of the conflict’s eventual outcome.
The Federal Reserve’s Warflation Dilemma: The Policy Trap
Warflation creates a uniquely challenging policy environment for the Federal Reserve, and the 2026 version may be the most difficult version of this challenge since the 1970s. The dilemma has a specific technical structure that warrants careful explanation.
The Federal Reserve’s standard toolkit — adjusting the federal funds rate — works differently against demand-pull inflation than against warflation. For demand-pull inflation (too many dollars chasing too few goods), raising interest rates reduces borrowing and spending, cooling demand and thereby reducing upward price pressure. This tool is effective precisely because it addresses the cause: excess demand.
For warflation (a supply-side shock reducing the availability of goods while increasing their cost), raising interest rates does not increase oil supply, reopen the Strait of Hormuz, or restore Gulf fertilizer exports. What it does do is reduce demand — making consumers and businesses less willing to spend — which does put some downward pressure on prices at the cost of weaker economic growth and higher unemployment. This is the fundamental policy trap: fighting warflation with rate hikes is expensive in economic growth terms because you are treating a supply problem with a demand-reduction tool, accepting growth damage to achieve price stability.
Not raising rates risks allowing warflation to embed in wage and price expectations, producing the 1970s scenario where brief supply shocks were tolerated and became decade-long structural inflation. The Federal Reserve held rates at 3.50–3.75% at its March 18, 2026 meeting, explicitly citing the uncertainty about whether the energy shock would prove temporary (in which case rate hikes would be mistaken) or persistent (in which case rate hikes would be necessary). The Bank of England made the same calculation. The ECB postponed its planned cuts. Every major central bank in the world is watching the Strait of Hormuz status as the primary input to their next policy decision — a degree of single-chokepoint dependency on monetary policy decision-making that has no modern precedent.
Claudia Sahm’s original framework for the Sahm Rule — which she designed to trigger automatic fiscal stimulus rather than monetary policy — is directly relevant here: warflation is precisely the scenario in which fiscal policy (direct household support, targeted energy assistance, windfall profit taxes on energy companies) is more effective than monetary policy at addressing the distributional and demand-support dimensions of the shock, while monetary policy holds the line against embedded inflation expectations. The 2026 Federal Reserve’s “wait and see” posture reflects the application of this lesson.
What Warflation Means for Every American Household: Practical Guidance
Warflation is not an abstract macroeconomic phenomenon — it is the direct cause of the $4+ gas prices, the elevated grocery bills, the rising mortgage costs, and the airline ticket increases that American households are experiencing right now. Understanding its mechanics enables more effective practical responses.
Budgeting for warflation persistence: The March 2026 CPI of 3.3% is not the warflation peak — it is the first measurement. Oxford Economics explicitly warned “it’s going to get more painful in April” as full-month energy price increases appear in the data. The OECD’s 4.2% full-year forecast for 2026 implies continued elevated CPI through Q3 at minimum. Household budgets should be recalibrated for a 4–5% annual price increase across energy-related categories (gasoline, electricity, home heating) and a delayed 3–5% increase in food categories as fertilizer costs transmit to farm and grocery prices in fall 2026.
Transportation cost management: At $4+ per gallon nationally and higher in high-tax states like California ($5.87+), vehicle fuel costs represent the single most immediately impactful warflation expense for most households. Every 10 miles per gallon improvement in fleet fuel economy represents approximately $600–$800 in annual savings at current prices for the average American driver. Remote work options, trip consolidation, carpooling, and public transportation all have meaningfully higher financial returns at $4+ gas than they did at $2.97 gas in late February.
Food cost anticipation: The fertilizer warflation channel — Channel 3 in this analysis — will materialize in grocery stores approximately 6–9 months after the spring 2026 planting season. That means elevated food prices in fall 2026 and through 2027 are a near-certainty regardless of the Strait of Hormuz’s eventual reopening status, because spring planting has already been completed under fertilizer-stressed conditions. Building a modest pantry buffer of non-perishable essentials now, while prices are elevated but before food warflation peaks, is the most direct practical hedge against this upcoming wave.
Emergency fund as warflation protection: The combination of warflation-driven real income reduction (when wages rise slower than prices) and elevated recession risk creates a specific household financial vulnerability: workers face both reduced purchasing power and higher-than-normal job loss risk simultaneously. A 6-month emergency fund — calibrated to the new, higher cost-of-living baseline that warflation has established — provides the financial resilience buffer that protects households from the worst outcomes if both wage stagnation and job loss materialize together.
Fixed-rate debt as an inflation hedge: Existing fixed-rate mortgages locked in before the warflation episode represent one of the few natural inflation hedges available to ordinary households. If your mortgage rate is 3–5% and inflation is running at 3.3–4.2%, your effective real debt cost is diminishing — the dollars you repay are worth less than the dollars you borrowed. Households that can maintain or extend existing fixed-rate obligations in this environment benefit from the inflation component of warflation even while facing its cost-of-living impact.
When Does Warflation End? The Conditions for Resolution
Warflation does not end with a single policy announcement or a single economic data release. It ends when the supply-side disruptions that caused it are resolved and when the price expectations they generated have been worked out of the wage and price-setting system. Historical warflation episodes suggest four conditions are necessary for genuine resolution:
Physical supply restoration: The most important condition is the reopening of the disrupted supply chain — in 2026, this means meaningful resumption of maritime oil and LNG transit through the Strait of Hormuz. The fragile ceasefire announced April 8, 2026 is a necessary but not sufficient condition: the strait must actually reopen, mine hazards must be cleared, insurance underwriters must restore normal coverage, and shipping companies must recommence regular transit schedules before physical supply normalizes.
Commodity price normalization: Even after physical supply resumes, oil prices may remain elevated above pre-war levels for months due to: rebuilding of depleted strategic reserves, uncertainty premiums on future conflict risk, and the reconfiguration of supply contracts around alternative routes. The 1973 embargo ended in March 1974 but oil prices remained elevated for years, contributing to continued warflation pressure well after the immediate crisis resolved.
Second-round effect containment: If warflation has begun embedding in wage negotiations and price-setting behavior — which core CPI data suggests may be beginning in 2026 — monetary policy must address these expectations even after supply normalizes. This is the hardest part of warflation resolution and explains why 1970s warflation required a decade to fully resolve despite the physical oil supply situation normalizing much earlier.
Geopolitical risk premium reduction: Financial markets price ongoing geopolitical risk into commodity prices even in the absence of active supply disruption. After a major warflation episode, the world’s assessment of the baseline risk of future disruption to the same supply chain changes permanently — meaning some residual warflation premium may persist indefinitely, as the world reprices Gulf energy geopolitical risk in light of the 2026 demonstrated vulnerability.


💬 0 Comments