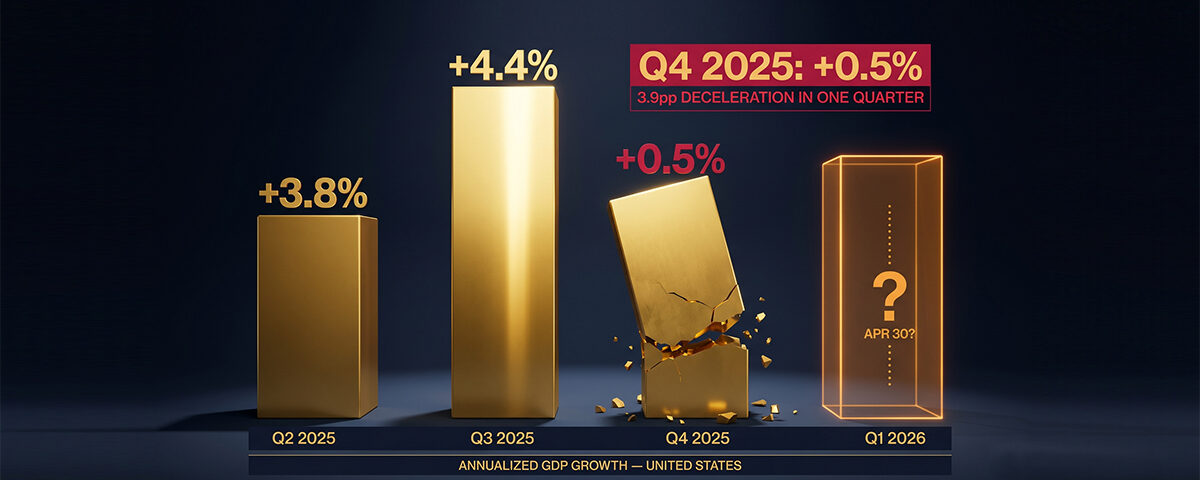
On April 9, 2026, the Bureau of Economic Analysis released the third and final estimate for Q4 2025 GDP growth — and the number that arrived was sobering. Real gross domestic product grew at an annualized rate of just 0.5% in the fourth quarter of 2025, revised down from the second estimate of 0.7% and dramatically lower than the 4.4% growth recorded just one quarter earlier in Q3. The full-year 2025 growth rate came in at 2.1% — down from 2.8% in 2024 — and the economy entered 2026 already wounded before the Iran war began on February 28 and before the Strait of Hormuz effectively closed on March 4.
EY’s macroeconomics team captured the moment precisely: “Despite a solid 2.1% expansion for the full year, 2025 will likely be remembered as the year that ‘could have been.’ A rare confluence of supply shocks — tariffs, tighter immigration and elevated policy uncertainty — constrained activity, leaving growth below what strong organic productivity gains and rapid AI adoption would have otherwise produced.”
The Q4 GDP 0.5% final estimate is not merely a backward-looking data point. It is the foundation from which 2026’s economic trajectory begins — and understanding what caused it, what it signals, and what comes next is essential for every American trying to understand whether a recession is genuinely approaching. This cornerstone guide examines the Q4 GDP figure in complete analytical depth: the three-estimate revision journey from 1.4% to 0.5%, what drove the collapse from Q3’s 4.4%, the GDP components that held and those that failed, the Q1 2026 advance estimate arriving April 30, the Iran war’s overlay on an already-fragile growth picture, and what the data means practically for households, investors, and policymakers.
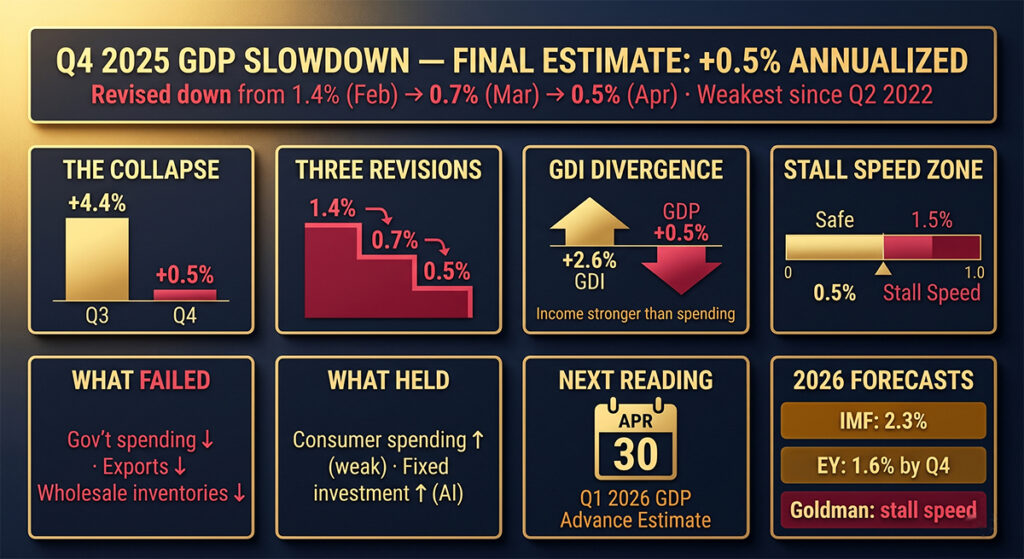
The BEA’s final Q4 2025 GDP estimate of 0.5% annualized — released April 9, 2026 — represents the weakest quarterly growth since Q2 2022. The number was revised down three times: from an advance estimate of 1.4% (February 20) to 0.7% (March 13) to the final 0.5% (April 9). The deceleration from Q3 2025’s 4.4% growth — a swing of 3.9 percentage points in a single quarter — is the sharpest quarterly deceleration since the pandemic. The economy enters Q1 2026 at stall speed, with the Iran war energy shock, sustained tariff pressure, and a hiring recession layered onto a growth foundation that was already crumbling before any of these additional headwinds materialized. The April 30 Q1 2026 advance GDP estimate is the next critical data point.
The Three-Estimate Journey: How Q4 GDP Was Revised from 1.4% to 0.5%
Understanding the Q4 2025 GDP story requires understanding how the BEA’s three-estimate release process works and why each successive revision moved in the same direction — sharply downward — rather than oscillating as revisions sometimes do.
The Bureau of Economic Analysis publishes GDP estimates in three rounds following each quarter’s end. The advance estimate, released approximately one month after the quarter closes, uses the most complete but still incomplete source data available. The second estimate, released approximately two months after quarter-end, incorporates updated source data from surveys with higher response rates. The third estimate, released approximately three months after quarter-end, incorporates near-final source data and represents the official GDP figure for the quarter.
The Q4 2025 GDP revision sequence was notably unusual in its scale and consistency of direction:
| Estimate | Release Date | Q4 GDP (Annualized) | Change from Prior | Primary Revision Driver |
|---|---|---|---|---|
| Advance Estimate | February 20, 2026 | 1.4% | — | First read; already below 2.8% consensus forecast |
| Second Estimate | March 13, 2026 | 0.7% | −0.7pp | Downward revisions to exports, consumer spending, government spending, investment |
| Third Estimate (Final) | April 9, 2026 | 0.5% | −0.2pp | Downward revision to investment, primarily private inventory investment in wholesale trade |
The cumulative downward revision from advance to final — 0.9 percentage points — is unusually large. Most quarters see relatively minor revisions between estimates. The consistency of the downward direction across all three revisions suggests that the initial advance estimate was capturing genuine economic conditions accurately but that every additional data source confirmed or deepened the weakness rather than providing evidence of strength that had been initially missed.
Notably, the Q4 2025 advance estimate was itself already delayed from its originally-scheduled January 29, 2026 release date — rescheduled due to the October–November 2025 government shutdown. This shutdown, which also delayed the second estimate from its original February 26 schedule, is itself a GDP drag: the BEA estimated the shutdown reduced government spending, one of the four components of GDP, contributing directly to the weak Q4 reading. The irony noted by multiple analysts is fitting — the government shutdown that delayed the GDP report also helped produce the weak number the report contained.
The Q3 to Q4 Collapse: Anatomy of a 3.9 Percentage Point Deceleration
The most striking feature of the Q4 2025 GDP report is not the absolute level of 0.5% — weak but not catastrophic in isolation — but the magnitude of the deceleration from Q3 2025’s 4.4% growth. A swing of 3.9 percentage points in a single quarter is among the sharpest peacetime quarterly decelerations in modern US economic history. Understanding what drove Q3’s strength and what failed in Q4 provides the essential context for assessing whether the slowdown is cyclical or structural.
What Q3 2025 Got Right
Q3 2025’s 4.4% annualized growth — confirmed in the updated BEA estimate released January 22, 2026 — was driven by broad-based strength: increases in consumer spending, exports, government spending, and investment all contributed positively. This was an unusually clean quarter of across-the-board expansion, and it created the impression — at the time — that the US economy had found sustainable post-pandemic cruising altitude. The Q3 figure reinforced the soft-landing narrative and contributed to the market optimism that characterized late 2025.
What Went Wrong in Q4 2025
The Q4 breakdown is the mirror image. The BEA’s final estimate identified the primary drivers of the weakness as decreases in government spending and exports — both components that had been positive in Q3 — while consumer spending and investment remained positive contributors but at reduced rates. The government spending decline reflects both the October–November 2025 government shutdown’s direct drag on federal expenditure and the broader policy-driven reduction in government outlays that had been accelerating through the period. The export decline reflects the impact of US tariff escalations on trading partner retaliatory measures and the global growth slowdown that reduced demand for US goods.
The downward revision from the second to the third estimate was driven specifically by private inventory investment in wholesale trade — a component that reflects businesses’ decisions about how much goods to stock. The decline in wholesale inventory investment suggests that businesses reduced their stocking levels in Q4, either because they anticipated weaker demand ahead or because elevated borrowing costs made carrying large inventories financially unattractive. Either interpretation implies a forward-looking caution on the part of the business sector that validates the economic anxiety that characterized the quarter.
The Gross Domestic Income (GDI) picture adds important nuance. While GDP came in at 0.5%, real GDI rose 2.6% in Q4 — significantly higher. Gross Domestic Output (GDO), the average of GDP and GDI considered a more forward-looking gauge, rose at a 1.5% annualized pace. The divergence between GDP (0.5%) and GDI (2.6%) is notable: GDP and GDI measure the same economic output from different angles (the spending side vs. the income side), and large divergences are common at cyclical turning points. The higher GDI reading suggests that while final demand measured through expenditure accounts was very weak, the income generated by the economy was more robust — a pattern consistent with a temporary slowdown rather than a structural collapse, but one that must be monitored as Q1 2026 data arrives.
The GDP Component Breakdown: What Held, What Failed
A complete understanding of the Q4 GDP slowdown requires examining each of the four primary GDP components — consumer spending (C), business investment (I), government spending (G), and net exports (NX) — and understanding their specific contribution to the headline number.
Consumer Spending: Still Positive But Decelerating
Consumer spending remained a positive contributor to Q4 GDP — the one clear bright spot in the report. Americans continued spending in Q4 despite elevated prices, higher interest rates, and growing concern about the economic outlook. However, the pace of consumer spending growth decelerated meaningfully from Q3’s robust expansion, reflecting the increasing pressure on household budgets from 2025 tariff-driven retail price increases and the depletion of pandemic-era savings buffers that had provided financial cushion through 2023 and most of 2024.
The consumer spending reading carries particular importance for 2026 forecasting because consumer spending represents approximately 70% of US GDP. The advance estimate for Q4 had shown consumer spending as the primary growth engine; subsequent revisions modified this picture downward without eliminating it. The question heading into Q1 2026 — before the answer arrives in the April 30 advance estimate — is whether the Iran war’s impact on gas prices (up 35%+ since February 28) has reduced consumer spending on other categories enough to push the spending contribution from positive to negative. Advisor Perspectives’ analysis was direct: “The war in Iran is likely to weigh on consumer spending in 2026. An additional tax in the form of higher prices at the pump will likely dent consumer spending elsewhere.”
Investment: Dragged Down by Inventory Decisions
Business investment remained a positive contributor in headline terms but was revised downward significantly between the second and third estimates due to the wholesale inventory decline described above. Fixed investment — in equipment, intellectual property, and structures — remained more resilient than the inventory component, reflecting the continued AI data center buildout and technology investment that has been a structural growth driver throughout 2024 and 2025.
The divergence between fixed investment (resilient) and inventory investment (declining) is analytically significant. Fixed investment reflects long-term business confidence in future demand and productivity growth — and the AI investment cycle has provided durable support here that appears largely independent of near-term economic conditions. Inventory investment, by contrast, reflects near-term business expectations about the trajectory of demand — and the negative Q4 inventory reading suggests businesses were positioning for weaker demand ahead, not stronger.
Government Spending: The Shutdown’s Direct GDP Cost
Government spending was a clear negative contributor to Q4 GDP — a reversal from Q3’s positive government contribution. The October–November 2025 government shutdown reduced federal expenditure for approximately six to eight weeks of the quarter, directly subtracting from the GDP calculation as government purchases of goods and services declined. This shutdown-driven drag is technically a one-time factor that should not persist into Q1 2026 — but the broader policy direction of reduced federal spending, combined with the DOGE-driven workforce reductions that have been phasing through 2025–2026, represents an ongoing structural headwind to the government spending component that extends well beyond any single shutdown episode.
Net Exports: Tariff Retaliation and Global Slowdown
Net exports (exports minus imports) were a negative contributor to Q4 GDP. Exports declined — reflecting both the impact of US trading partners’ retaliatory tariff measures reducing demand for US goods and the global growth slowdown that reduced overall demand for internationally traded products. The import component declined as well — which is arithmetically positive for GDP since imports are subtracted — but the net export contribution remained negative because the export decline was more pronounced than the import decline.
The trade picture heading into 2026 is complicated by the Iran war’s overlay. The IMF’s April 2026 World Economic Outlook projected that world trade volume growth would fall from 5.1% in 2025 to just 2.8% in 2026 — nearly halved — due to the combination of the energy shock, higher global shipping costs, and continued US-China trade tensions. Reduced global trade volume translates directly into reduced US export opportunities, suggesting that the net export component will likely continue to be a drag on US GDP through 2026 unless the Hormuz situation resolves and shipping costs normalize.
The Context: Why Q4 0.5% Was the “Could Have Been” Quarter
EY’s characterization of 2025 as “the year that could have been” deserves examination, because it captures something important about what makes the Q4 GDP reading particularly significant. The US economy in 2025 had genuine structural momentum that was suppressed by policy choices and external shocks rather than by any fundamental deterioration in the economy’s productive capacity.
Productivity growth in 2025 was strong — driven by the early-stage effects of AI adoption across multiple sectors, which allowed output to be produced with a smaller marginal increment of labor input. The technology investment cycle, fueled by the AI infrastructure buildout at Amazon, Microsoft, Google, Meta, and thousands of smaller companies, sustained business fixed investment at levels that would normally be associated with stronger GDP growth. Consumer balance sheets, while under pressure, remained fundamentally more resilient than at comparable points in prior cycles.
Against this productive backdrop, the specific headwinds that produced Q4’s 0.5% were largely policy-generated or shock-related rather than cyclical: the 2025 tariff cycle’s impact on import costs and trading partner retaliation on US exports; the immigration policy tightening that reduced labor supply growth; the government shutdown’s direct GDP subtraction; and the policy uncertainty that froze hiring and investment decisions in the corporate sector. None of these headwinds reflects a breakdown in the economy’s underlying productive capacity — they are external constraints on an economy that, absent those constraints, would have grown meaningfully faster.
This distinction matters enormously for the recovery forecast. An economy that is weak because its productive capacity has deteriorated (as in the aftermath of the 2008 financial crisis, which damaged bank capital, household balance sheets, and business investment appetite for years) requires a long, structural recovery. An economy that is weak because of specific, potentially reversible policy and shock headwinds can recover more quickly when those headwinds ease. The Q4 2025 GDP reading is more consistent with the latter characterization — but the Iran war’s entry into the equation as an additional and potentially more durable headwind complicates this otherwise moderately optimistic assessment.
Stall Speed Economics: Why 0.5% Is Particularly Dangerous
Economic theory and historical data both identify the concept of “stall speed” — a growth rate below which an economy becomes increasingly vulnerable to recession even without additional external shocks. The analogy is from aviation: an aircraft that slows below its stall speed loses the aerodynamic lift required to remain airborne and enters an uncontrolled descent. An economy that slows below its stall speed loses the momentum required to absorb shocks, maintain employment, and sustain consumer and business confidence — and becomes susceptible to a feedback loop where slowing growth produces caution, which produces less spending and investment, which produces more slowing.
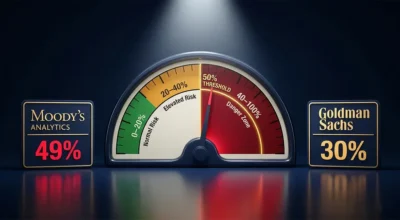
Most economists place the US stall speed — the growth rate below which recession risk escalates significantly — at approximately 1.0–1.5% annualized. At 0.5%, Q4 2025 was clearly below this threshold. Goldman Sachs had specifically used the phrase “stall speed” to characterize its H2 2026 growth forecast of 1.25–1.75% — noting that at those rates, the economy would be highly sensitive to any additional negative shock. With Q4 already at 0.5%, the economy entered 2026 at a growth rate that was already below stall speed — meaning that even without the Iran war, the Q1 2026 growth trajectory was already precarious.
The Iran war’s arrival on February 28 — less than two months into Q1 2026 — compounded an already vulnerable growth foundation. The March CPI reading of 3.3% (up from 2.4% in February) arrived as the first full-month reflection of the war’s price impact. Consumer sentiment plunged to a record low of 47.6 in April. Gas prices crossed $4/gallon for the first time since 2022. Each of these developments represents an additional demand headwind layered onto a growth base that had already decelerated to stall speed in the prior quarter.
The April 30 Q1 2026 GDP Advance Estimate: What to Expect and What to Watch
The most consequential near-term economic data release on the calendar is the BEA’s Q1 2026 GDP advance estimate, scheduled for April 30, 2026. This will be the first real-time read on how the economy performed in January, February, and March — the quarter that begins with 2025’s stall-speed momentum and ends with the first full month of Iran war economic impact.
The Q1 2026 advance estimate will be divided into three distinct sub-periods that will be difficult to separate in the aggregate data but are analytically separable:
January–mid-February (pre-war): The period before February 28 reflects the inherited momentum from Q4 2025’s 0.5% growth. January’s jobs report was relatively encouraging (+130,000 payrolls, above the 55,000 consensus), providing some hope of stabilization. Consumer spending in January and early February, while under pressure from persistent 2025 tariff-driven retail price increases, showed tentative resilience. This sub-period likely contributed modestly positive growth to Q1’s aggregate.
Late February–mid-March (initial shock): The two-to-three weeks immediately following the February 28 strikes on Iran and the March 4 Hormuz closure produced the most acute near-term economic disruption: oil prices surging past $100, shipping insurance cancellations, airline fuel surcharge implementations, immediate consumer uncertainty spike, and the business investment freeze that accompanies sudden geopolitical shocks. February’s −92,000 payrolls shock — released March 7 — was the first major data point capturing this period’s labor market impact. This sub-period likely subtracted meaningfully from Q1 growth.
Mid-March through March 31 (shock normalization): The period following the IEA’s March 11 emergency reserve release and the partial stabilization of oil markets at approximately $100/barrel represents a shock-normalized state — not resolution, but the first establishment of a new elevated-but-stable price level. The March jobs report (+178,000, released April 3) was the first genuine positive surprise of 2026, suggesting the labor market had not yet fully buckled under the war’s weight.
The net of these three sub-periods for Q1 GDP is genuinely uncertain. Goldman Sachs’s early March modeling suggested Q1 GDP at approximately 2.1% under the scenario of oil averaging $110 in March and April — but that forecast predates the partial stabilization and the stronger-than-expected March jobs report. More recent forecaster consensus, reflecting the April 8 ceasefire announcement and partial market normalization, has shifted toward Q1 GDP growth in the 1.0–1.5% range — technically an improvement from Q4’s 0.5% but still well below the stall-speed comfort zone and far below Q3 2025’s 4.4% pace.
A negative Q1 2026 GDP reading — while not the consensus forecast — would be the first quarterly negative GDP print since Q2 2022 (when the US briefly flirted with the technical two-quarter-negative definition of recession). Two consecutive quarters of negative GDP (Q4 2025 was 0.5%, so Q4 alone is positive) would require Q1 2026 to come in negative and Q2 2026 to follow — but economists are clear that even one negative quarter significantly elevated recession risk perceptions and market anxiety regardless of the technical NBER definition.
GDP Slowdown vs Recession: The Definitions That Matter
The Q4 GDP 0.5% reading and the trajectory toward Q1 2026 make this an appropriate moment to clarify the definitions that will determine whether the current slowdown is characterized as a recession — distinctions that carry significant practical consequences for policy, market behavior, and household decision-making.
Technical recession (the popular definition): Two consecutive quarters of negative real GDP growth. This definition, while widely used in media and public discourse, is not the official US definition and is not how the NBER determines recessions. Under this definition, Q4 2025 at 0.5% does not contribute to a technical recession unless Q1 2026 comes in negative.
NBER recession (the official definition): The National Bureau of Economic Research is the official arbiter of US recessions and uses a broader definition: “a significant decline in economic activity that is spread across the economy and that lasts more than a few months.” The NBER considers six primary indicators: real personal income minus transfers, nonfarm payroll employment, real personal consumption expenditures, wholesale and retail sales, industrial production, and real GDP. Under the NBER’s multi-factor definition, the current episode does not yet clearly qualify as a recession — employment, while slowing, has not shown the kind of sustained deterioration that the NBER typically requires, and real personal income has remained positive.
Growth recession (the most relevant current concept): A period of growth that is too slow to reduce unemployment, improve living standards, or maintain the economic momentum required to avoid deteriorating into contraction. At 0.5% annualized, Q4 2025 was clearly in growth recession territory — the economy was technically expanding but at a rate so slow that it could not absorb the labor market disruption from AI displacement, immigration reduction, and government sector contraction simultaneously occurring. A sustained period at 0.5–1.5% annualized growth represents a growth recession even without the technical two-quarter-negative signal.
The Iran War Overlay: From GDP Slowdown to Recession Risk
The Q4 2025 GDP slowdown would have been a significant story in its own right — a major deceleration from Q3’s strength, a signal of stall-speed vulnerability, a harbinger of a difficult 2026 growth environment. The Iran war’s beginning eight weeks after the Q4 period ended has transformed the story from “disappointing but manageable” to something more concerning.
The IMF’s April 2026 World Economic Outlook cut the US 2026 growth forecast to 2.3% — which, while above recession, is below the pre-war 2.4% forecast and represents a downgrade from what the IMF said it would have upgraded to (3.4%) absent the conflict. EY revised its PCE inflation forecast upward by 0.5 percentage points and reduced its real GDP momentum estimate to 1.6% by Q4 2026 — a pace that is uncomfortably close to the stall-speed threshold described above. The US Federal Reserve’s March meeting minutes showed policymakers divided over whether the next rate move should be a hike or a cut — the clearest signal yet of the stagflation dilemma that the energy shock creates.
The arithmetic of the Q4 2025 GDP slowdown makes the Iran war’s timing particularly dangerous. If the economy had entered 2026 at Q3’s 4.4% pace, the war’s energy shock would represent a significant deceleration but would have significant momentum buffer to absorb before reaching stall speed. Starting from Q4’s 0.5%, the economy has almost no buffer — any meaningful additional demand shock risks tipping the GDP reading into negative territory.
Sixty-five percent of consumers expected a recession in the next 12 months as of March 2026 — up six percentage points from February — according to NerdWallet’s consumer survey. Consumer confidence often becomes a self-fulfilling signal: when consumers expect recession, they cut spending, which reduces demand, which slows growth, which validates the recession expectation. Starting from Q4’s 0.5% base, this sentiment-driven demand reduction mechanism has significantly less room to play out before the economy crosses from growth recession into technical recession.
State-Level GDP: The Geographic Distribution of Q4 Weakness
The BEA’s third estimate release included state-level GDP data that reveals the geographic distribution of Q4 2025’s weakness — a dimension that the national headline obscures. The range was stark: real GDP growth at the state level ranged from a 3.8% increase in North Dakota (energy sector strength from elevated oil prices) to an 8.3% decrease in the District of Columbia — a decline that directly reflects the government shutdown’s impact on the federal employment and contracting base that dominates DC’s economy.
The DC decline is particularly notable because it simultaneously illustrates the GDP damage the shutdown caused and previews the long-term economic consequence of sustained federal workforce reduction through DOGE. Washington DC’s economy is structurally dependent on federal employment — approximately 30% of DC jobs are directly federal, with a substantial additional share in federal contracting and services. As federal employment contracts, DC’s economic base shrinks, and the spending multiplier effects of reduced federal worker income ripple through the broader regional economy including suburban Virginia and Maryland.
Beyond DC, the state-level data reveals geographic clustering of weakness in sectors experiencing structural contraction: states with high concentrations of technology employment (particularly those outside the Bay Area and New York metro areas that are more exposed to tech sector correction without the diversification of those larger metro economies) and states with significant federal contractor presence showed the most consistent weakness.
What the GDP Slowdown Means for Households, Investors, and Policy
The Q4 GDP 0.5% reading and the 2026 trajectory it inaugurates carry specific practical implications across three domains.
For households: A GDP slowdown of this magnitude — particularly one that has stalled at 0.5% rather than recovering — translates into reduced hiring, slower wage growth, and compressed household income gains. The EY analysis noted that higher inflation from the Iran war would produce “weaker real disposable income growth” — meaning that even if nominal incomes hold, the purchasing power of those incomes is declining as energy and food prices rise faster than wages. The practical implication is the same message that flows from the job seeker recession analysis: build financial resilience, reduce discretionary spending, defer major commitments, and treat the April 30 Q1 GDP advance estimate as the next critical data point that will determine whether the growth recession deepens or stabilizes.
For investors: GDP at 0.5% represents an environment where earnings growth is constrained, consumer demand is limited, and the margin for corporate earnings disappointment is reduced. Sectors most exposed to demand weakness in a slow-growth environment — consumer discretionary, advertising, retail, transportation — face the greatest earnings risk. Sectors that provide essential services regardless of economic conditions — healthcare, utilities, consumer staples — are most protected. The IMF’s downward revision to US growth to 2.3% for 2026, combined with the Fed’s rate hold dilemma, suggests that the interest rate environment will provide less support to asset prices than investors may have anticipated entering the year. Defensive positioning is not capitulation; it is the rational response to a growth environment that provides minimal buffer against additional negative surprises.
For policy: The Federal Reserve faces its most difficult policy environment since the early 1980s. The Q4 GDP 0.5% reading argues for rate cuts — the economy clearly needs monetary support. The March CPI 3.3% reading and OECD’s 4.2% full-year US inflation forecast argue against rate cuts — cutting rates into rising inflation risks entrenching the price surge. The April 28–29 FOMC meeting will be the first major test of how the Fed navigates this dilemma. The Fed’s March meeting minutes showed the divide explicitly: some members favored holding rates indefinitely amid inflation uncertainty, while others believed the growth slowdown warranted preemptive easing. The Q1 GDP advance estimate on April 30 — one day after the FOMC meeting — will either validate or challenge whatever decision the Fed makes.
💬 0 Comments