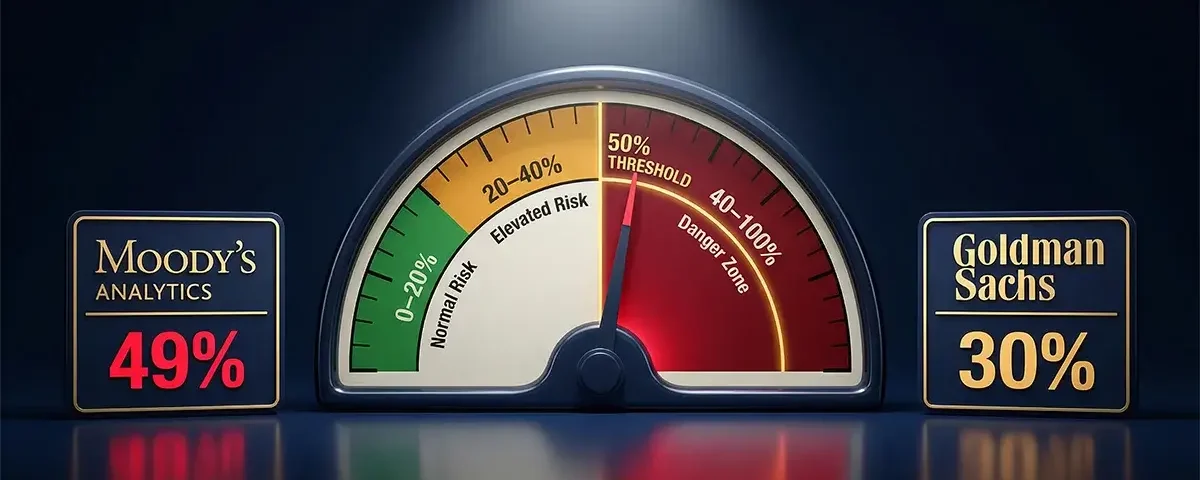
Two of the most respected economic forecasting institutions in the world are now sounding alarms that demand the attention of every American investor, business owner, and household manager. Moody’s Analytics has deployed a machine-learning recession model — trained on 80 years of backtested US economic data and with a perfect historical record — that as of April 2026 shows 49% odds of a US recession beginning within the next 12 months. Goldman Sachs, in its third upward revision of 2026, has raised its own 12-month recession probability to 30%. The baseline probability of a US recession in any given 12-month period, for context, is approximately 15–20%.
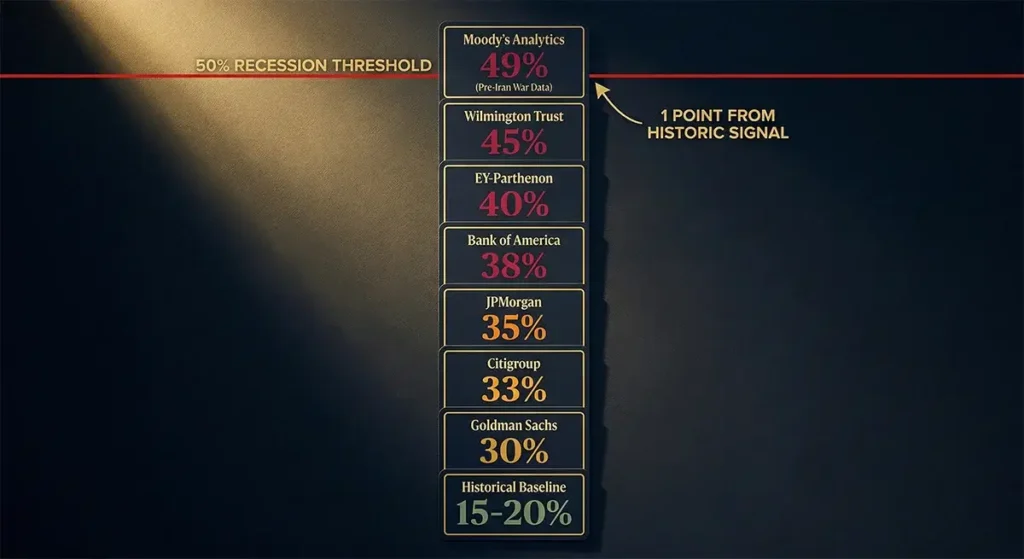
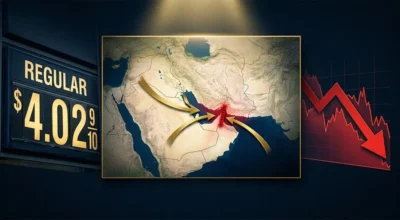
Every major Wall Street forecasting institution has revised its recession odds sharply upward in the first quarter of 2026. EY-Parthenon sits at 40%. Wilmington Trust at 45%. JPMorgan at 35%. The convergence of these forecasts around elevated risk levels — from institutions whose economic models, methodologies, and assumptions differ significantly — suggests this is not noise. It is signal. And the most alarming element of the Moody’s figure is not the 49% itself — it is the fact that 49% was calculated using February 2026 data, before the US-Iran war that has since disrupted 20% of global crude oil production and sent gasoline prices above $4 per gallon for the first time since 2022.
Moody’s Analytics’ AI recession model has a perfect historical record: every single time it has crossed 50% in 80 years of backtested data, a US recession followed within 12 months. It currently reads 49% — on pre-Iran-war data. Moody’s Chief Economist Mark Zandi has explicitly stated he expects the model to cross 50% when updated March and April data incorporating the oil shock is processed. Goldman Sachs is more conservative at 30%, but has revised upward three times in 2026 alone and describes the US economy as approaching “stall speed.” Both institutions agree: the US economy is more fragile than it has been at any point since the 2020 pandemic shock, and the risks are rising, not falling.
Understanding the Moody’s AI Recession Model: The Signal That Has Never Been Wrong
To understand why Moody’s 49% reading is attracting so much attention, it is essential to understand what the model is and what its historical track record actually shows. Moody’s Analytics introduced its machine-learning recession model in 2025 — a system trained on 80 years of US economic data that incorporates a broad range of leading, coincident, and lagging economic indicators to produce a probability estimate of recession onset within the next 12 months.
The model’s historical track record, as verified through backtesting against the full post-World War II economic record, shows a clear binary pattern around the 50% threshold: every time the model’s probability reading has exceeded 50%, a US recession has materialized within 12 months. This is not a guarantee of future accuracy — no economic model carries a guaranteed forward track record — but it is a historical signal with no false positives in 80 years of backtested data. The significance of the current 49% reading is therefore not merely the number itself, but its proximity to a threshold that has, in historical data, functioned as a near-certain recession predictor.
Moody’s Analytics Chief Economist Mark Zandi, in his note accompanying the March 2026 model update, identified the primary drivers of the elevated reading. “Behind the recent jump are primarily the weak labor market numbers, but almost all the economic data has turned soft since the end of last year,” Zandi wrote. He further noted the model’s critical sensitivity to energy prices: “It isn’t a stretch to expect the indicator to cross the key 50% threshold amid the Iranian conflict and the resulting surge in oil prices. Oil prices are an important variable in the model, and with good reason: every recession since WWII, save the pandemic recession, has been preceded by a spike in oil prices.”
In a Euronews interview following the model’s release, Zandi was explicit about the labor market’s role as the single biggest factor driving the model’s elevated reading: “Employment in February fell, and has gone more or less sideways for the past year. Employment is the best measure of coincident economic activity.” He added a particularly alarming data point about the reliability of recent labor market data: 16 of the last 19 Bureau of Labor Statistics job reports have been revised downward shortly after their initial release — the highest rate of downward revision since 2008. “If anything, it suggests the job market is even weaker and recession risks are even higher than the current data shows,” Zandi concluded.
The Moody’s Model’s Key Inputs: What Is Actually Driving the 49% Reading
The Moody’s AI recession model incorporates a wide range of economic variables. Understanding which specific inputs are flashing most urgently in early 2026 clarifies why the reading has risen so sharply — and why the Iran war’s oil shock is expected to push it above 50%.
Labor market deterioration: February 2026 nonfarm payrolls fell by 92,000 — the first monthly job loss outside of a recession in years, and sharply below the consensus estimate of a 60,000-job gain. This single data point was the most significant labor market miss since the beginning of the COVID pandemic. The unemployment rate edged upward to 4.44–4.5%, up from 3.4% just three years earlier. Wage growth has decelerated, particularly for lower-income American workers — the population whose consumption patterns most directly drive the retail and services sectors that comprise the majority of US GDP.
Energy costs — the historical recession trigger: The Moody’s model weights energy costs heavily, reflecting the empirical historical record. According to Irwin Stelzer of the Hudson Institute, before each of the four major post-war downturns — 1973–75, 1980, 1981–82, and 1990–91 — real energy prices climbed by an average of 17.5% ahead of the recession’s onset. The current energy shock, driven by the closure of the Strait of Hormuz since March 4, 2026, has produced Brent crude price increases of more than 55% from pre-war levels. This energy shock magnitude significantly exceeds the average historical threshold that has preceded recessions — and this variable had not yet been incorporated into the February 2026 model reading of 49%.
Residential building permits: Zandi specifically cited declines in residential building permits as a significant contributing factor. Permit issuance — a forward-looking indicator of construction activity — has softened meaningfully as elevated mortgage rates continue to suppress housing market activity.
Consumer sentiment: Consumer confidence has fallen to levels that, historically, have been associated with recession conditions or near-recession conditions. The University of Michigan Consumer Sentiment Index reading of 57–59 in early 2026 sits below the 60 threshold historically correlated with economic contractions.
Soft economic data broadly: Zandi’s characterization that “almost all the economic data has turned soft since the end of last year” is confirmed by the Q4 2025 GDP reading of just 0.7% annualized — down sharply from 4.4% in Q3 2025. This deceleration of 3.7 percentage points between consecutive quarters is the kind of momentum shift that the Moody’s model is designed to detect as a leading recession signal.
Goldman Sachs’s Recession Analysis: Three Upward Revisions and Counting
Goldman Sachs’s recession probability trajectory in 2026 tells a story of progressively deteriorating economic confidence at one of Wall Street’s most influential institutions. The progression:
| Date | Goldman Sachs 12-Month Recession Probability | Primary Driver of Revision |
|---|---|---|
| January 2026 | 20% | Baseline — pre-Iran war, tariff concerns emerging |
| Early March 2026 | 25% | Labor market softening, tariff drag on growth |
| Mid-March 2026 | 30% | Iran war oil shock, Strait of Hormuz closure impact |
| Current (April 2026) | 30% (most recent published figure) | Energy costs, labor market fatigue, fading fiscal support |
Goldman’s March 2026 weekly US economics update — authored by chief economist Jan Hatzius and his team — provided the most detailed public articulation of the bank’s economic concern. The bank cut its full-year 2026 US GDP forecast to 2.1% on a Q4/Q4 basis, with second-half 2026 growth projected at only 1.25–1.75% — a range the firm explicitly described as near “stall speed,” the threshold below which small shocks can tip an economy from weak growth into contraction.
On inflation, Goldman raised its PCE inflation forecast by 0.2 percentage points to 3.1% by December 2026 and nudged its core PCE forecast to 2.5% — both above the Federal Reserve’s 2% target and both moving in the wrong direction at a time when the Fed needs inflation progress to justify rate cuts that the economy increasingly needs for support. Goldman projects two Federal Reserve rate cuts in 2026 — in September and December — with the federal funds rate ending the year at 3.00–3.25%. These cuts, the bank argues, would provide meaningful economic support but would only materialize after months of additional economic deterioration first.
The unemployment outlook from Goldman is sobering: the bank projects unemployment rising to 4.6% by Q3 2026, from the current 4.44–4.5%. Goldman attributed the labor market’s deterioration to insufficient job creation to keep pace with labor force growth, compounded by a 0.4 percentage point downward revision to labor force participation based on updated Census data that painted a weaker picture of worker attachment than previously understood.
Goldman’s “Top of Mind” report, released March 20, contained perhaps the most pointed institutional warning in the bank’s recent public communications: global assets were pricing in only “inflationary shocks” while “completely ignoring” the impact of high energy costs on economic growth — a dynamic the bank cautioned could shift toward “recession trading” if the Iran conflict persists beyond the bank’s assumed six-week Hormuz disruption timeline.
The Complete Wall Street Recession Probability Dashboard: April 2026
The divergence and convergence across Wall Street’s major forecasting institutions in 2026 provides a uniquely comprehensive picture of institutional economic thinking. Here is the complete dashboard as of early April 2026:
| Institution / Economist | 12-Month Recession Probability | Notable Position / Comment |
|---|---|---|
| Moody’s Analytics (Mark Zandi) | 49% (AI model) / “near 50%” | Model based on Feb data — expects 50%+ when Iran war energy data incorporated; baseline normally 20% |
| EY-Parthenon (Gregory Daco) | 40% | Up from 35% before Iran conflict; cites cascading LNG infrastructure damage beyond oil markets |
| Wilmington Trust | 45% | Among the most bearish major institutional forecasters |
| JPMorgan | 35% | Bob Michele warns Iran war is not an inflation “speed bump”; sticky price pressures into H2 2026 |
| Goldman Sachs (Jan Hatzius) | 30% | Third upward revision in 2026; still not base case; sees GDP at “stall speed” H2 2026 |
| Oxford Economics | Threshold model | Oil at $140+ sustained for 2 months = global recession trigger; current trajectory approaching threshold |
| BNP Paribas | Below Wall Street average | US “well-positioned to absorb shock” as world’s largest oil producer; most optimistic major institution |
| Historical baseline (any 12-month period) | 15–20% | Every major forecaster is now running at least double the historical background rate |
The most striking feature of this dashboard is not any individual number — it is the near-universal direction of travel. Every major institution has revised upward in 2026. Not a single major institution has revised downward from its pre-Iran-war position. And the institution most widely respected for the rigor and track record of its methodology — Moody’s Analytics — is sitting 1 percentage point below the threshold that has preceded every recession in 80 years of its model’s backtested history.
What Goldman Sachs and Moody’s Agree On: The Pre-Existing Fragility
One of the most important — and most underreported — dimensions of the current recession probability assessments is that both Goldman Sachs and Moody’s Analytics agree that the Iran war oil shock did not create a fragile economy from a strong one. It found an already-fragile economy and amplified its existing vulnerabilities.
Goldman Sachs was explicit on this point in its weekly update: “the bank argues that, even before the oil shock, the U.S. economy was edging toward a tipping point.” The pre-existing vulnerabilities Goldman identified include the labor market softening predating the war, fading fiscal support as prior tax cuts and government spending programs roll off, and tightening financial conditions from the sustained period of elevated interest rates. All three of these pre-war factors contributed to the January and early-March upward revisions — before Brent crude crossed $100 per barrel.
Moody’s assessment parallels Goldman’s: Zandi described a picture in which the February 49% reading reflected primarily pre-war deterioration in labor markets and economic data. “Almost all the economic data has turned soft since the end of last year,” he wrote — a statement that encompasses the Q4 2025 GDP deceleration to 0.7%, the 92,000-job February loss, the 16 of 19 BLS downward revisions, rising credit card delinquency rates (which reached post-financial-crisis highs in late 2025), and the contraction in the ISM Manufacturing PMI that has persisted for most of the past 18 months.
The implication is economically significant: the pre-existing weakness means the oil shock’s required magnitude to trigger recession is lower than it would have been in a robust economy. Sam Ori of the University of Chicago’s Energy Policy Institute identified a specific threshold: historically, when oil costs reach 4–5% of GDP and remain elevated, recession has always followed. The US economy’s weakened starting position means it will approach this threshold at a lower oil price than it would have in 2022 or 2023.
Where Goldman Sachs and Moody’s Diverge: Methodology, Assumptions, and Risk Assessment
Despite their shared direction, the gap between Goldman’s 30% and Moody’s 49% is substantial — and the methodological reasons for the divergence are instructive for interpreting both figures.
The Goldman approach — scenario-weighted conditional probability: Goldman’s 30% figure is a weighted average across multiple economic scenarios, with a base case of slower-but-positive growth remaining the most likely single outcome. Goldman’s base case assumes the Strait of Hormuz disruption resolves within approximately six weeks — a relatively optimistic assumption given the conflict’s trajectory as of early April 2026 — and that the US’s status as the world’s largest oil producer provides meaningful insulation from the energy shock. Goldman also does not expect the oil shock to “durably unhinge” inflation expectations in the way the 1970s oil shocks did — a critical assumption that determines whether the Federal Reserve is forced to choose between fighting inflation and supporting growth in a stagflation trap.
The Moody’s approach — machine learning on historical indicator patterns: The Moody’s AI model is not a scenario-based forecast. It is a pattern-recognition system trained on 80 years of historical economic data. It identifies when the current configuration of economic indicators matches the historical configurations that preceded recessions — and produces a probability estimate based on how frequently those historical configurations were followed by recessions. Because the model’s February reading of 49% used pre-Iran-war data, it did not incorporate the oil price variable that Zandi identifies as a critical model component. With March and April oil price data incorporated, he expects the model to cross 50%.
The key assumption difference: Goldman’s 30% implicitly assumes the conflict is relatively short and that US oil production partially offsets the global supply disruption. Moody’s 49% reflects pre-war economic deterioration and will incorporate the oil shock variable when updated. If the Strait remains closed beyond Goldman’s assumed six-week timeline — which, as of April 3, appears increasingly likely — Goldman’s own framework would push its probability estimate toward 40–45%, significantly narrowing the gap with Moody’s.
The Federal Reserve’s Impossible Position
Both Goldman and Moody’s analyses implicitly acknowledge the Federal Reserve’s increasingly constrained policy options — a constraint that significantly affects recession probability regardless of which institution’s baseline proves more accurate.
The standard monetary policy response to a weakening economy is rate cuts — reducing the cost of borrowing to stimulate spending and investment. Goldman projects two cuts in 2026, in September and December. But the oil shock has complicated this timeline by simultaneously pushing inflation higher — PCE now forecast at 3.1% versus the Fed’s 2% target — while economic growth decelerates. The Fed’s dual mandate (maximum employment and price stability) pulls in opposite directions in this environment: supporting employment and growth argues for rate cuts; maintaining price stability argues for holding rates or even raising them.
The Federal Reserve held rates steady at 3.50–3.75% at its March 18, 2026 meeting with a hawkish dot plot. Chair Jerome Powell downplayed stagflation concerns at the post-meeting press conference, characterizing the energy shock as potentially temporary. JPMorgan’s Bob Michele was the most prominent voice pushing back: he argued that price pressures from the war would be “sticky” well into the second half of 2026, not the transitory blip that would allow rapid Fed easing. If Michele is correct, the Fed’s constrained ability to cut rates when growth softens most severely is itself a recession amplifier — removing the monetary policy backstop that has helped abort or shorten several post-2000 downturns.
Goldman’s projection of September and December rate cuts assumes the Fed will gain enough inflation confidence by mid-year to begin easing. This timeline requires either: (a) a relatively swift resolution of the Hormuz crisis that brings oil prices back toward pre-war levels, or (b) sufficient economic deterioration that the Fed prioritizes growth support over inflation vigilance. Neither scenario is comfortable — the first requires diplomatic or military developments that remain highly uncertain, the second means waiting for the economy to weaken further before providing relief.
The Three Pre-War Recession Risk Factors That Were Already Present
Understanding the recession probability discussion requires accounting for the three structural risk factors that Goldman Sachs and Moody’s both identified as existing before the Iran war began on February 28, 2026.
Factor 1 — Tariff-driven inflation and trade uncertainty: The Trump administration’s 2025–2026 tariff regime imposed cost increases across a wide range of imported goods and domestically-produced goods using imported inputs. This supply-side inflationary pressure was already complicating the Fed’s ability to cut rates before the oil shock — creating a stagflationary dynamic that the Iran war has amplified rather than created from scratch. Goldman had already raised its January recession probability from 15% to 20% specifically because of tariff concerns — before any Middle East military action.
Factor 2 — Labor market deterioration predating the war: The February 2026 jobs report — a loss of 92,000 payroll positions, the first monthly loss outside a recession since the early pandemic period — was released on March 7, a week after the Iran war began but reflecting labor market conditions that existed before the conflict. Goldman economists attributed the deterioration to insufficient job creation to absorb new labor force entrants and a broader soft landing that had gone softer than anticipated. The 16 of 19 downward revisions to BLS reports since 2024 suggest the labor market was weaker than real-time data indicated throughout this period.
Factor 3 — Fading fiscal support: The economic boost provided by the 2022–2024 fiscal spending programs — infrastructure investments, semiconductor manufacturing incentives, clean energy subsidies — has been progressively rolling off as projects complete and one-time spending flows wind down. The private sector investment expected to replace this government demand stimulus has been slower to materialize than projected, leaving a gap in aggregate demand just as the energy shock hits.
Goldman’s explicit statement that “the economy was in a far less resilient position than it was just months ago” reflects the compounding of all three pre-war factors with the post-war energy shock — producing the stacked vulnerabilities that make the current moment distinctly more dangerous than any single factor in isolation would suggest.
The Oil Price Threshold Question: How High Is Too High?
Oxford Economics has attempted to quantify the specific oil price level that would trigger a US recession, providing a useful threshold framework for monitoring the risk in real time. Their modeling suggests oil prices would need to average approximately $140 per barrel over a two-month period to push the US economy into recession — a figure that serves as a useful reference point for interpreting current market levels and forward projections.
As of early April 2026, Brent crude is trading at approximately $112 per barrel — below the $140 Oxford threshold but with significant upside risk if the Strait of Hormuz remains closed. Goldman’s commodity team forecast Brent averaging $115 in April and then retreating to $80 by year-end, assuming six weeks of Hormuz disruption. If the conflict extends to 10–12 weeks — broadly consistent with what energy executives at CERAWeek were signaling — oil could average $120–$130 for Q2 2026, approaching but not necessarily breaching the $140 recession threshold for the two-month sustained period Oxford identified.
The sensitivity of both Moody’s and Goldman’s models to energy prices is the critical variable that links oil market developments to recession probability in real time. Every $10 increase in sustained Brent crude price, held for multiple months, pushes both models’ recession probability estimates higher. Conversely, a diplomatic resolution that brought Brent back toward $80–$85 would simultaneously reduce inflation pressure, free up household spending power, enable faster Fed rate cuts, and materially lower both Moody’s and Goldman’s recession probability estimates — confirming the Strait of Hormuz’s status as the single most important economic variable in the world in April 2026.
What These Recession Odds Mean for Investors: Institutional Guidance
Both Goldman Sachs and Moody’s Analytics provide guidance — directly and through their public communications — for how investors should interpret and respond to elevated recession probabilities. Their recommendations converge on several themes.
Elevated probability does not mean certain recession: Goldman’s 30% means there is a 70% probability of no recession in the next 12 months — a majority outcome that is recession-free. Moody’s 49% means there is slightly more than a coin-flip probability of recession — still not certain. Both institutions explicitly caution against panic-selling financial assets in response to elevated recession odds. “The market has always recovered and set new highs following a bear market, no matter how deep,” noted The Motley Fool’s analysis of the Moody’s reading. Goldman similarly maintains equity market exposure recommendations for long-term investors, adjusting tactical positioning while maintaining strategic allocation.
Adjust positioning toward quality and defensiveness: Goldman’s equity strategy team has shifted recommendations toward defensive sectors (healthcare, utilities, consumer staples) and away from economically sensitive sectors (discretionary consumer, industrials, materials) in the elevated-recession-risk environment. This “quality tilt” reflects the higher probability of earnings deterioration in cyclical sectors relative to defensive ones during economic slowdowns.
Fixed income duration as a hedge: In both Goldman’s and Moody’s frameworks, a recession would likely produce significant Federal Reserve rate cuts — potentially faster and deeper than the two cuts Goldman’s base case projects. Longer-duration Treasury bonds typically appreciate when the Fed cuts rates aggressively, providing a portfolio hedge against recession-induced equity market losses. Goldman’s treasury yield forecasts have shifted to reflect both the inflation risk (pressuring yields higher) and the growth deceleration risk (pressuring yields lower in a flight-to-safety scenario) — producing meaningful uncertainty around the direction of rates that argues for balanced duration positioning.
Energy sector positioning: The current oil price environment creates divergent impacts across sectors. Domestic US energy producers benefit directly from higher oil prices — companies operating in the Permian Basin, Eagle Ford, and other US shale plays are seeing substantially improved cash flows and are being pressed by the government to increase production. Airlines, consumer discretionary companies, chemical manufacturers, and logistics companies face the opposite impact, with energy costs as a major operational headwind.
What These Recession Odds Mean for American Households: Practical Preparedness
For American families who are not professional investors, the Moody’s and Goldman recession probability assessments have direct practical implications that extend beyond portfolio management to household financial resilience planning.
Job security assessment: In the recession scenarios these models are quantifying, unemployment rises from the current 4.44–4.5% toward 5.0–6.0%, with Goldman projecting 4.6% by Q3 2026 in its base case and higher in recession scenarios. The job losses would be concentrated in the most energy-price-sensitive and economically cyclical sectors: airlines, hospitality, retail, construction, manufacturing, advertising, and media. Workers in these industries should conduct honest self-assessments of their job security and take preparatory steps — building emergency reserves, reducing discretionary debt, and maintaining active professional networks — that position them to weather potential income disruption.
Emergency fund sizing relative to recession scenarios: The Moody’s and Goldman frameworks implicitly define what an “adequate” emergency fund means in a 30–49% recession probability environment. A minimum of 6 months of essential living expenses — the standard recommendation during elevated recession risk periods — should be the target for any household currently below that level. Households in highly vulnerable sectors (airlines, hospitality, construction) should target 9–12 months. The energy shock simultaneously increases the cost of those essential expenses (through higher gasoline and food prices) and reduces the monthly cash flow available to build reserves — making the construction of adequate emergency buffers more urgent and more difficult simultaneously.
Debt management in a high-rate, high-uncertainty environment: If either Goldman’s or Moody’s recession scenario materializes, the Federal Reserve’s rate-cutting response — while ultimately forthcoming — will lag the deterioration in economic conditions by months. During this lag period, households carrying high-rate variable debt (credit cards at 22%+ APR, adjustable-rate mortgages) face both income risk from potential job losses and rate risk from continued elevated borrowing costs. Aggressively reducing high-rate consumer debt in the current environment reduces financial vulnerability to the recession scenario while also generating a guaranteed return (the avoided interest cost) that compares favorably to most investment alternatives in an uncertain market environment.
Monitor the leading indicators that precede these models’ updates: Both Moody’s and Goldman update their recession probability assessments as new economic data arrives. The most important monthly data releases to monitor — which will directly move both institutions’ probability estimates — are: the monthly nonfarm payrolls report (first Friday of each month, released by the BLS), the Consumer Price Index (mid-month, released by the BLS), the Federal Reserve’s PCE inflation gauge (released at month-end), and crude oil price movements as a proxy for the Strait of Hormuz situation’s evolution. A payrolls report showing job losses for a second consecutive month would likely push Goldman toward 35–40% and Moody’s model above 50%. A diplomatic breakthrough reopening the Strait would have the opposite effect on both.
The Historical Precedent: When Have These Models Been At This Level Before?
To calibrate the significance of a Moody’s reading of 49% and a Goldman reading of 30%, it is useful to examine when these institutions have previously issued comparable recession probability assessments and what followed.
Moody’s AI model, trained on 80 years of data, has reached the 50% threshold before every recession in its backtested history. The most recent documented instances of Goldman’s recession probability reaching 30% or above were: March 2020 (COVID pandemic onset), when Goldman rapidly moved to 30%+ before the brief but sharp COVID recession materialized; early 2022, when Goldman raised its probability to 35% in response to the Russia-Ukraine war’s energy shock and the Fed’s aggressive rate hiking cycle, before ultimately not experiencing a technical recession (though real income fell significantly for two years as inflation outpaced wage growth); and 2007–2008, when Goldman’s probability progressively increased toward and above 50% ahead of the Great Recession.
This historical context has two equally valid interpretations. On the bearish side: 30% at Goldman has preceded recessions in 2008 and 2020. On the more nuanced side: 30% also preceded 2022, which produced significant economic pain but not a technical recession — because policy responses (Federal Reserve action, commodity price normalization) intervened before GDP crossed the definitional threshold. The current situation’s outcome will similarly depend on how quickly the energy shock resolves and whether policy responses (Fed cuts, SPR releases, potential Strait reopening) arrive before or after GDP turns negative.

💬 0 Comments