A new class of economic indicators has emerged in 2025 and 2026 that Wall Street analysts, Federal Reserve researchers, and professional investors are increasingly tracking alongside traditional forecasting tools: prediction markets. On platforms like Polymarket and Kalshi, tens of thousands of traders stake real money on whether the US economy will enter a recession by the end of 2026 — and the prices they collectively set produce a continuously updating, crowd-sourced probability estimate that responds to breaking economic data faster than any quarterly institutional forecast can.
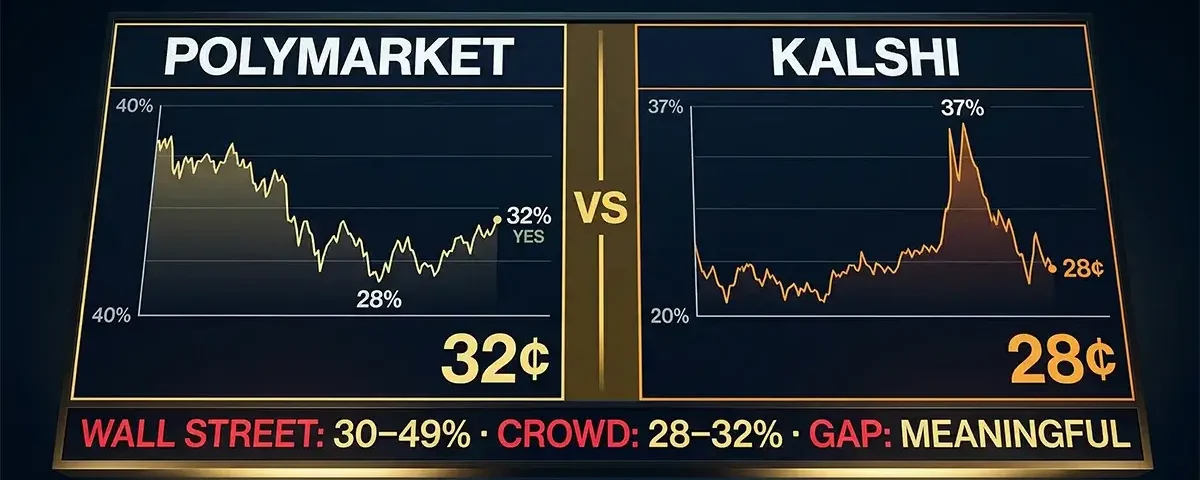
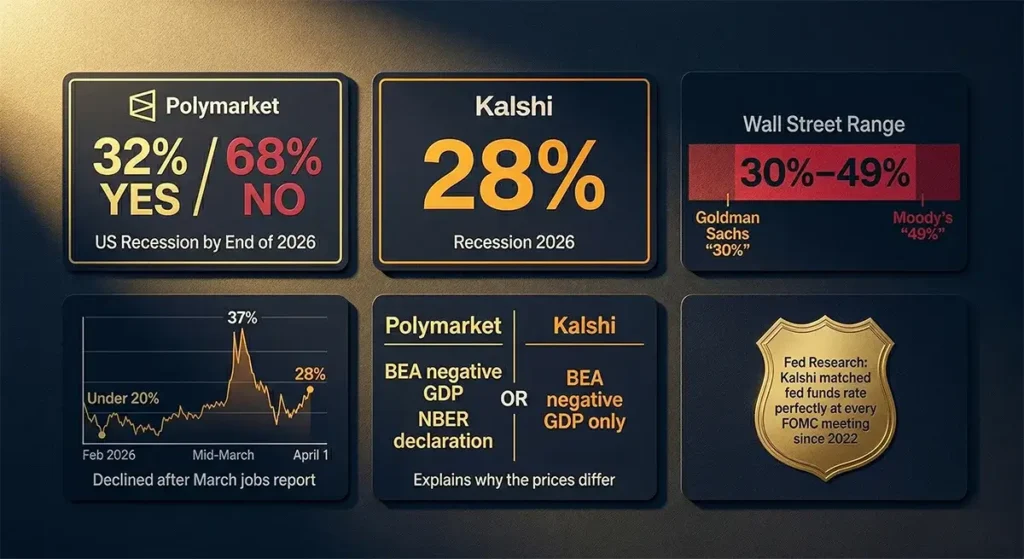
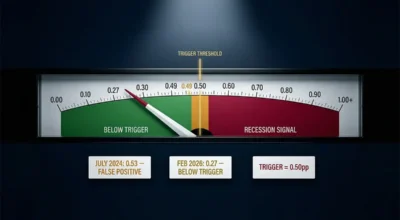
As of April 6, 2026, the two largest prediction market platforms are telling a nuanced and rapidly shifting story. Polymarket currently prices the probability of a US recession by end-2026 at approximately 32% — meaning traders collectively place 68% odds against a recession materializing this year. Kalshi, the CFTC-regulated American platform, stood at approximately 28% as of April 1 — having swung from below 20% in early February to nearly 37% in late March as oil prices crossed $100 per barrel following the Iran war, then pulled back after the March jobs report delivered a stronger-than-expected 178,000 payroll gain. These numbers are not static — they are live market prices that respond within hours to every new economic data release, Fed statement, and geopolitical development. Understanding what they mean, why they move, and how to read them alongside traditional Wall Street forecasts is the subject of this complete guide.
Prediction markets provide something traditional economic forecasts cannot: a real-time, continuously updated probability that incorporates the collective judgment of thousands of financially motivated traders. As of April 6, 2026, Polymarket prices a 32% recession probability and Kalshi prices 28% — both significantly below the 40–49% estimates from institutional economists like EY-Parthenon and Moody’s Analytics. The gap reflects important methodological differences: prediction markets price what financially-motivated traders collectively believe will happen under specific resolution rules, while institutional models incorporate broader economic signal sets. A Federal Reserve research paper has validated Kalshi’s accuracy for monetary policy forecasting, finding its mode has perfectly predicted the federal funds rate at every FOMC meeting since 2022. However, a Vanderbilt University study found both platforms encourage herd behavior. Used correctly, prediction market prices are a powerful real-time supplement to — not a replacement for — rigorous economic analysis.
What Are Prediction Markets and How Do Recession Contracts Work?
Before examining the specific recession probabilities, it is essential to understand precisely what prediction markets are, how their prices are generated, and what the resolution rules mean for how to interpret the numbers correctly.
A prediction market is a financial exchange where users buy and sell binary contracts that pay $1 if a specified outcome occurs and $0 if it does not. The current market price of a “Yes” contract reflects the collective implied probability of that outcome, as determined by the willingness of buyers and sellers to trade at various price levels. Unlike surveys, which simply ask respondents what they think will happen, prediction markets require participants to put real money behind their beliefs — creating a financial incentive for accuracy and against wishful thinking. A trader who consistently overestimates recession probability will lose money on “Yes” contracts that resolve “No.” This financial discipline is the theoretical foundation of prediction markets’ claim to superior forecasting accuracy.
The specific recession contracts on Polymarket and Kalshi have carefully defined resolution rules that every serious user must understand before interpreting the prices:
Polymarket’s “US Recession by End of 2026” contract resolves “Yes” if either of two conditions is met: (1) The seasonally adjusted annualized percent change in quarterly US real GDP from the previous quarter is reported below 0.0% for two consecutive quarters between Q2 2025 and Q4 2026, inclusive, as reported by the Bureau of Economic Analysis (BEA) — with advance estimates considered; or (2) The National Bureau of Economic Research (NBER) publicly announces that a recession has occurred in the United States at any point during 2025 or 2026, with the announcement made by the time the BEA releases the advance estimate for Q4 2026. If neither condition is met, the market resolves “No.”
Kalshi’s recession contract uses a narrower definition: two consecutive quarters of negative US GDP growth as reported by the BEA — the “technical recession” definition. Critically, Kalshi’s contract does not incorporate the NBER declaration pathway that Polymarket includes. This definitional difference is meaningful: the NBER has historically declared recessions that did not technically meet the two-consecutive-quarters test (and vice versa), meaning the same economic outcome could resolve differently on the two platforms.
This resolution rule difference partly explains why Polymarket’s 32% is slightly higher than Kalshi’s 28% — Polymarket’s contract can resolve “Yes” via either the NBER or GDP path, making it slightly broader in scope and therefore marginally more likely to resolve positively in borderline economic scenarios.
The Complete Prediction Market Price History: How We Got to 32% and 28%
The trajectory of both platforms’ recession prices in 2025 and early 2026 is itself a real-time economic history — and understanding the price path clarifies why current levels should be interpreted with full context.
The 2025 Recession Market — The Control Case: Polymarket ran a parallel market throughout 2025 asking whether the US would enter a recession that year. The market ultimately resolved at approximately 99% “No” in late December 2025, with $11.4 million in total trading volume — the platform’s largest-ever economy contract by volume at the time. The high volume is significant: it suggests the market was actively contested, with real money on both sides, and the final resolution was unambiguous. The 2025 recession did not materialize despite genuine concern through mid-year, and the market’s trajectory through 2025 — which had reached above 40% at points — demonstrates how dramatically prediction market prices can move in response to changing economic conditions before ultimately converging on the correct outcome.
The 2026 Recession Market’s Journey:
| Period | Polymarket (Approx.) | Kalshi (Approx.) | Key Driver |
|---|---|---|---|
| Late September 2025 (market launch) | ~40–45% | N/A | Initial pricing amid tariff uncertainty |
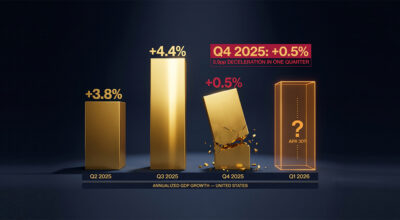
| Late 2025 | ~28–30% | ~28% | Strong Q3 2025 GDP (4.4%), easing inflation |
| Early February 2026 | ~31% | <20% | Pre-war baseline; labor market still firm |
| Late February – Early March 2026 | ~31% | ~25% | Feb 28 Iran war begins; oil starts surging |
| March 9, 2026 | ~31% | ~34% | Kalshi spikes as oil tops $100/barrel first time since 2022 |
| Mid-March 2026 | ~31% | ~37% (near-peak) | Hormuz closure confirmed; February -92K jobs report shock |
| Late March 2026 | ~31–32% | ~34% | Sustained oil shock; Goldman raises recession odds to 30% |
| April 1, 2026 | ~32% | ~28% | March jobs report (+178K, beats +59K estimate) causes pullback |
| April 6, 2026 (current) | 32% YES / 68% NO | ~28% | Ongoing Hormuz uncertainty; strong jobs data providing floor |
Two dynamics in this price history deserve particular attention. First, Kalshi moved far more dramatically in response to the Iran war oil shock than Polymarket — swinging from below 20% to 37% in approximately six weeks, a 17-percentage-point move. Polymarket’s price was comparatively stable, remaining in the 31–32% range throughout the same period. This divergence likely reflects differences in the two platforms’ trader bases: Kalshi’s CFTC-regulated, account-based structure attracts more US-based macro-oriented traders who may have responded more immediately to the oil shock’s US economic implications, while Polymarket’s global crypto-native user base may incorporate more internationally diverse perspectives on the same event.
Second, the March 2026 jobs report — which showed +178,000 payroll additions against expectations of +59,000, with unemployment falling to 4.3% — produced a significant pullback in Kalshi’s recession odds (from ~34% to ~28%) while having a more muted effect on Polymarket. A single strong jobs number, in the context of ongoing oil shock and geopolitical uncertainty, moved real money in prediction markets within hours of its release.
Polymarket vs Kalshi: Platform Deep Dive
To read recession prediction market prices intelligently, it is necessary to understand the fundamental structural differences between the two platforms — because those differences shape whose money is trading, under what rules, and with what degree of liquidity.
Kalshi — The Regulated American Exchange: Kalshi operates as a Designated Contract Market (DCM) under the direct regulatory oversight of the Commodity Futures Trading Commission (CFTC) — the same regulatory framework that governs the Chicago Mercantile Exchange and other major US derivatives markets. This means Kalshi’s contracts are federally approved financial instruments, not unregulated prediction pools. Users fund accounts via bank transfer, trade through an order book interface that resembles a brokerage platform, and have regulatory protections comparable to those on traditional financial exchanges. Kalshi raised $1 billion at an $11 billion valuation in late 2025 — an extraordinary institutional endorsement of its business model — and has struck data distribution agreements with CNN and CNBC, putting its real-time market prices on major financial news channels beginning in 2026. The Robinhood “Prediction Markets Hub,” which routes retail investors to Kalshi for event-based trading, has become a significant funnel for the platform’s retail user base. Kalshi cleared over $43.1 billion in total contract volume in 2025.
Polymarket — The Global Decentralized Exchange: Polymarket operates as a decentralized prediction market using USDC (a dollar-pegged cryptocurrency) and blockchain-based smart contracts. Users interact with the platform through crypto wallets rather than brokerage accounts, and trades settle on-chain rather than through a central clearinghouse. This architecture makes Polymarket genuinely global — accessible to traders in markets where Kalshi’s US regulatory framework does not extend — and allows it to list new markets faster than Kalshi’s approval process permits. Polymarket reached a $9 billion valuation in October 2025, with the Intercontinental Exchange (ICE) — parent company of the New York Stock Exchange — investing $2 billion in the platform in late 2025, one of the most significant institutional endorsements in prediction market history. Combined, the two platforms set a weekly trading volume record of $6.32 billion for the week ending February 1, 2026.
| Feature | Kalshi | Polymarket |
|---|---|---|
| Regulatory status | CFTC-regulated Designated Contract Market | Decentralized; limited US access historically |
| Settlement currency | USD (bank transfer) | USDC (cryptocurrency) |
| Trading interface | Order book — brokerage feel | On-chain smart contracts — Web3 feel |
| Valuation (2025) | $11 billion | $9–15 billion |
| Major backer | Retail via Robinhood; $1B raise | ICE (NYSE parent) $2B investment |
| Recession definition | BEA two consecutive negative GDP quarters only | BEA two consecutive quarters OR NBER declaration |
| Current recession odds | ~28% (April 1, 2026) | 32% YES / 68% NO (April 6, 2026) |
| Trader base character | US-based macro-oriented; brokerage users | Global; crypto-native; politically active |
How Accurate Are Prediction Markets? The Research Evidence
The most important question for anyone using prediction market prices as economic indicators is: how accurate are they? The academic and institutional research on this question is extensive and nuanced — and the answer is more complicated than either prediction market advocates or skeptics typically acknowledge.
The Federal Reserve’s Validation of Kalshi: The most authoritative endorsement of prediction market accuracy for macroeconomic forecasting comes from a research paper published by Federal Reserve economists examining Kalshi’s monetary policy markets. The paper’s findings were striking. It found that “Kalshi’s forecasts for the federal funds rate and CPI provide statistically significant improvements over fed funds futures and professional forecasters” — the two benchmarks that the entire financial system has historically relied upon for interest rate and inflation expectations. More specifically, the paper reported that Kalshi’s mode has “perfectly matched the realized federal funds rate by the day of each meeting since 2022” — a feat that neither Bloomberg consensus surveys nor fed funds futures had achieved with comparable consistency. For inflation specifically, Kalshi’s numbers beat the Bloomberg CPI consensus forecast. The paper also identified a distinctive risk characteristic: “In tougher economic scenarios, Kalshi puts far more weight on extreme inflation and weak growth than surveys” — suggesting prediction markets are particularly sensitive to tail risks like stagflation and recession, precisely the scenarios where conventional forecasters tend to anchor too closely to their baseline and underweight extreme outcomes.
The Vanderbilt Study’s Cautions: Not all research reaches favorable conclusions. A study by researchers Joshua Clinton and TzuFeng Huang at Vanderbilt University, examining 2,500 prediction markets with $2.5 billion in volume across Polymarket, Kalshi, and PredictIt, raised significant concerns about accuracy and market efficiency. The researchers found that Polymarket was the least accurate platform by their methodology, with Kalshi performing better but still with notable limitations. Most concerning for interpreting short-term price movements: 58% of Polymarket’s national presidential markets showed negative serial correlation — meaning a price spike one day was typically reversed the next. The researchers characterized this as “a textbook signal of noise trading and overreaction, not informed forecasting.” Both platforms were found to “encourage herd behavior driven by visibility and hype rather than news” — meaning high-profile media coverage of a market price can itself become a driver of that price, creating a feedback loop that is not grounded in economic fundamentals.
Superforecasters vs. Prediction Markets: Analysis published by Advisor Perspectives using the Brier score accuracy metric found that Tetlock’s “superforecaster” teams — ordinary individuals selected and trained for calibrated probabilistic thinking — had better accuracy scores than Polymarket prices alone. However, the research also found that the optimal forecasting approach was not to choose between them but to combine them: the ideal weighting was approximately 60% superforecasters and 40% Polymarket. Polymarket’s prices contain significant information that improves superforecaster estimates, and vice versa — suggesting the platforms and traditional expert judgment are complementary rather than substitutes.
The Bottom Line on Accuracy: The research consensus suggests a nuanced picture. Kalshi’s macro markets for Fed rate and CPI outcomes have demonstrated impressive accuracy and outperform traditional Wall Street tools. Polymarket’s prices contain useful information but show evidence of noise and herd behavior, particularly in short-term movements. Both platforms are most valuable as supplements to rigorous economic analysis rather than standalone forecasting tools — and both become significantly more informative when tracked over time rather than read as precise point estimates on any single day.
Prediction Markets vs Wall Street: The April 2026 Recession Probability Comparison
One of the most striking features of the current recession probability landscape is the significant gap between what prediction markets are pricing and what major institutional economists are projecting. This gap is not simply a discrepancy to be resolved — it reflects genuine methodological differences that make both sets of numbers informative in different ways.
| Source / Institution | Recession Probability (12 months) | Methodology | Definition Used |
|---|---|---|---|
| Moody’s Analytics (AI model) | 49% (pre-Iran war data) | Machine learning on 80-year historical data | NBER-style broad economic contraction |
| EY-Parthenon (Gregory Daco) | 40% | Econometric modeling + scenario weighting | NBER-style contraction |
| Wilmington Trust | 45% | Institutional economic modeling | NBER-style contraction |
| JPMorgan | 35% | Institutional economic modeling | NBER-style contraction |
| Goldman Sachs (Jan Hatzius) | 30% | Scenario-weighted conditional probability | NBER-style contraction |
| Polymarket (crowd) | 32% | Real-money prediction market aggregation | BEA two consecutive quarters OR NBER |
| Kalshi (crowd) | 28% | Real-money prediction market aggregation | BEA two consecutive quarters only |
| Oxford Economics threshold | Conditional on oil $140+ for 2 months | Econometric threshold modeling | NBER-style contraction |
The pattern is clear: prediction markets (28–32%) are pricing recession risk notably below the institutional economic models (30–49%), with Goldman Sachs at 30% sitting closest to Polymarket’s 32%. Several factors explain this gap.
Resolution rule differences: Institutional economists’ recession definitions align with the NBER’s broad assessment of economic activity — which can declare a recession even without two consecutive negative GDP quarters. The prediction markets’ definitions are more mechanical and require either BEA-confirmed consecutive negative GDP or an NBER declaration within a specified timeframe. In many historical near-recessions, GDP technically remained positive while economic conditions deteriorated significantly. Prediction market traders may be pricing the more specific BEA-trigger path while institutional economists are incorporating a wider range of recession scenarios.
The strong March jobs report’s outsized effect: The March 2026 payrolls report — +178,000 jobs against expectations of +59,000 — landed on April 3, just days before the current market readings. This single data point dramatically shifted short-term trader sentiment, pulling Kalshi from ~34% to ~28% within 48 hours. Institutional models updated on slower cycles and weight multiple data streams rather than single monthly releases, adjusted less dramatically to the same news. The prediction markets, in this instance, may be overweighting a single positive data point in an otherwise concerning trend.
Geopolitical uncertainty discounting: The Iran war and Hormuz closure represent a type of uncertainty that is particularly difficult for crowd-sourced markets to price — because the resolution depends on military and diplomatic developments that are genuinely unknowable. Prediction market traders may be anchoring to the historical base rate of “oil shocks don’t always produce recessions” rather than fully weighting the specific severity and duration risk of the current disruption.
The Critical Upcoming Catalysts: What Will Move Prices Next
Prediction market prices are dynamic and will shift materially in response to several specific upcoming events. These are the key catalysts that prediction market traders — and anyone using these markets as economic indicators — should monitor closely in the weeks ahead.
The April 28–29 FOMC Meeting: The Federal Reserve’s next scheduled policy meeting is the single most anticipated near-term catalyst for prediction market prices. Markets are currently pricing two rate cuts in 2026 — the first expected in September — but any signal from Chair Powell that the Fed is tilting toward earlier cuts (if economic deterioration accelerates) or ruling out cuts (if inflation from the oil shock proves more persistent) will immediately reprice both recession and inflation markets on both platforms. Kalshi’s track record of accurately predicting federal funds rate outcomes at individual FOMC meetings makes its real-time pricing during the meeting week particularly worth monitoring.
Q1 2026 GDP Advance Estimate: The Bureau of Economic Analysis will release its advance estimate of Q1 2026 GDP — the first quarter that will fully reflect the economic conditions of early 2026, including the beginning of the Iran war (which started February 28 but would affect March activity in Q1). If Q1 GDP is negative, it would represent one of the two consecutive negative quarters required for both platforms’ recession contracts to resolve “Yes” — and prediction market prices would immediately move to incorporate the probability of a second consecutive negative quarter in Q2. A positive Q1 reading, particularly above 1%, would significantly reduce near-term recession odds on both platforms.
The Strait of Hormuz resolution — or lack thereof: Energy market analysts have identified mid-April as the critical window for the Hormuz situation. If the strait reopens to meaningful shipping traffic by then, oil prices will fall, inflation concerns will ease, and prediction market recession odds will pull back meaningfully. If it remains closed through May and June, physically tight oil markets will emerge across Asia and Europe, prices will surge toward $130–$150, and prediction market recession odds will push sharply higher — potentially toward the 40–50% range that institutional economists are already pricing.
Monthly jobs reports: The April 2026 jobs report (released first Friday of May) will be the first payrolls data that fully reflects the Iran war’s economic impact on US employment. The leisure, hospitality, and transportation sectors — which are most sensitive to higher fuel costs and consumer confidence decline — will be watched especially closely. A second consecutive month of strong job gains would significantly reinforce the “no recession” narrative that currently prevails on both platforms. A payrolls miss — particularly if accompanied by a rising unemployment rate — would push prices sharply toward the institutional economists’ more pessimistic assessments.
How to Use Prediction Market Prices Responsibly: A Framework
For investors, business owners, and households watching the recession debate unfold, prediction markets offer a genuinely useful real-time signal — but only if used within an appropriate interpretive framework that accounts for their limitations.
Read the price as a probability distribution, not a point forecast: Polymarket’s 32% does not mean traders are 32% sure about what will happen. It means that at the current price, buyers and sellers are in equilibrium — there are enough traders willing to buy “Yes” at 32 cents and enough willing to sell it that the price has settled there. The true range of outcomes is wide, and a 32% price is entirely consistent with a world where recession is a genuine live possibility that thoughtful people should be prepared for.
Track the direction of price movement, not just the level: The most informative signal from prediction markets is often not the absolute level but the rate and direction of change. Kalshi moving from 20% to 37% in six weeks — driven by a specific, identifiable cause (the oil shock) — is more meaningful than any single reading taken in isolation. When both Polymarket and Kalshi are moving in the same direction simultaneously, the convergence carries more weight than either platform’s absolute price.
Pair prediction market prices with institutional forecasts: The research evidence supports treating prediction markets as a complement to institutional economic analysis rather than a replacement. When prediction market prices and institutional forecasts diverge significantly — as they currently do, with Kalshi at 28% and Moody’s at 49% — the divergence itself is informative. It suggests either that institutional models are overweighting structural risks that crowd-sourced markets are discounting, or that prediction market traders are underweighting long-horizon economic deterioration that institutional models capture better. In the current context, the most likely explanation is a combination: institutional models are more sensitive to the lagged and cumulative effects of the energy shock, while prediction markets are more responsive to recent positive data (the March jobs report).
Understand the resolution date constraint: Both platforms’ contracts resolve on a specific timeline tied to BEA GDP releases and the NBER declaration process. The NBER’s recession declarations typically lag economic events by 6–18 months — meaning a recession that begins in Q2 2026 might not be officially declared until 2027, potentially after the contract’s resolution window. This timing constraint can create divergences between what is economically happening and what the contract will resolve “Yes” on, which sophisticated prediction market traders factor into their pricing but casual observers may miss.
Monitor volume alongside price: A price movement in a low-volume prediction market carries less information than the same movement in a high-volume market. Polymarket’s 2025 recession market, with $11.4 million in volume, was a deep market whose prices were highly informative. The 2026 markets are still building volume — individual large trades can move thin markets in ways that do not reflect the full trader population’s consensus view. When assessing a price move, look at whether volume also spiked (suggesting broad trader conviction) or whether the move occurred on thin volume (suggesting it may reflect a single large bet rather than consensus repricing).
The Prediction Market’s Track Record: The 2025 Recession Market as a Case Study
The 2025 Polymarket recession market provides the most relevant recent case study for evaluating how well prediction markets tracked actual economic outcomes in a comparable uncertainty environment. The market was active throughout 2025, peaked at recession-yes probabilities above 40% at points during the year when tariff concerns and labor market softening produced genuine institutional uncertainty, and then declined through Q3 and Q4 2025 as the economy demonstrated resilience — ultimately resolving at approximately 99% “No” in December 2025 with $11.4 million in volume.
The 2025 experience offers three lessons for interpreting the 2026 market. First, prediction markets can reach 40%+ recession pricing and still resolve to “No” — as happened in 2025 when the economy avoided contraction despite genuine headwinds. Second, the markets can move dramatically in response to specific catalysts (the tariff announcements in early 2025 pushed prices to 40%+; the subsequent data showing economic resilience pulled them back below 20% by late 2025). Third, the ultimate resolution was accurate — no recession occurred in 2025 — suggesting the market did eventually price the correct outcome even if intermediate readings created anxiety.
The key difference between 2025 and 2026 is the Iran war’s oil shock. In 2025, the primary recession risk drivers were tariff-induced inflation and labor market softening — both significant but ultimately manageable by the economy. The 2026 risk involves an acute energy shock of a scale that historical precedent consistently associates with recession — a different category of risk that prediction market traders may be underweighting relative to the 2025 experience they just lived through.
What the Prediction Markets Are Saying Right Now — And What It Means for You
Synthesizing all of this evidence, what is the prediction market signal telling us as of April 6, 2026?
Polymarket’s 32% and Kalshi’s 28% — taken together — suggest that the financially motivated, real-money trader community is currently placing approximately 30% odds on a US recession materializing by end-2026. This is meaningfully above the historical background rate of 15–20% per year, confirming that these traders view the current environment as elevated risk — but notably below the 40–49% that the most prominent institutional economic models are generating. The gap represents the current unresolved tension between: the strong March jobs report’s positive signal; the ongoing severity of the Hormuz oil shock; and the underlying pre-war economic fragility that institutional models weight more heavily than short-term prediction market traders tend to.
For individual Americans, this framework suggests the most responsible interpretation: treat the prediction markets’ 30% odds as confirmation that elevated recession risk is real, financially-motivated, and worth preparing for — while recognizing that the 70% “no recession” probability they simultaneously imply means continued economic expansion remains the base case that most traders are currently betting on. The coming weeks — particularly the April FOMC meeting, the Hormuz situation’s evolution, and the Q1 GDP release — will provide the data that shifts these markets materially in one direction or the other. Watch both platforms’ prices following each of these events as a real-time barometer of how financially motivated crowd intelligence is assessing America’s economic trajectory.

💬 0 Comments