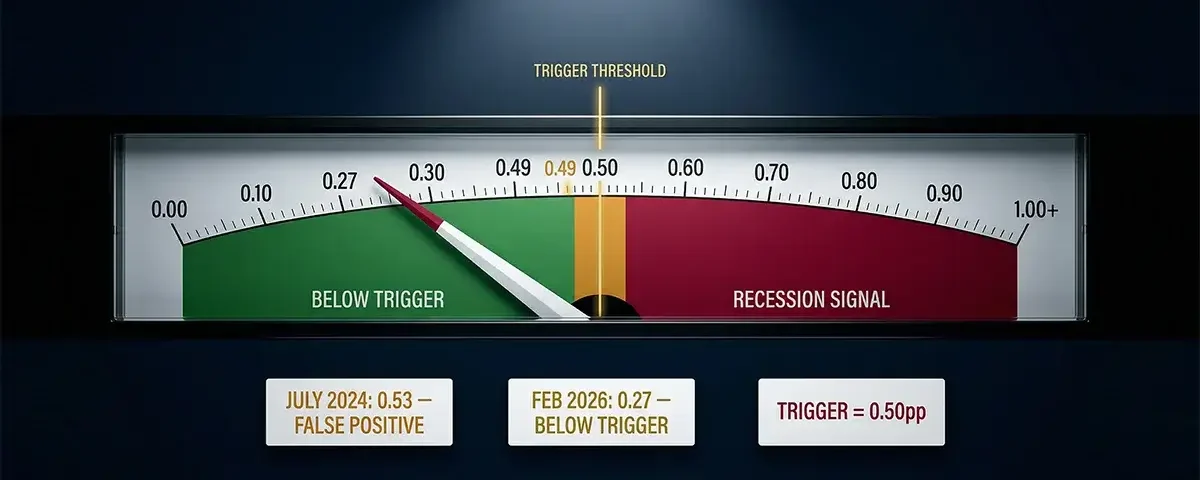
If you have been following economic news in 2024, 2025, or 2026, you have almost certainly encountered a phrase that causes markets to move, central bankers to react, and millions of Americans to search for answers: the Sahm Rule. In July 2024, the Sahm Rule triggered — a moment that sent shockwaves through financial markets and generated more economic anxiety headlines than any single data point in recent memory. The US economy ultimately did not enter recession that year, leading to a rich and still-unresolved debate about whether the rule had produced its first meaningful false positive or had simply been circumvented by an unusual set of circumstances. In early 2026, with the Sahm Rule reading at 0.27 — below the 0.5 trigger threshold but rising — and with the Iran war’s energy shock threatening to push unemployment higher in ways Claudia Sahm herself warned could change the calculation, the indicator is back at the center of the most important economic conversation in the world.
This cornerstone guide covers everything you need to know about the Sahm Rule: its origins, its exact mathematical mechanics, its perfect historical record across 11 recessions since 1950, the specific controversy surrounding its 2024 triggering, the current 2026 reading and what it means, the growing family of Sahm-inspired indicators, and the critical question of how much weight investors and households should place on this single economic signal in the extraordinarily complex environment of 2026.
The Sahm Rule is currently reading 0.27 as of February 2026 — below its 0.5 recession-trigger threshold but on a rising trend that has not reversed. Goldman Sachs projects unemployment rising to 4.6% by Q3 2026; if that projection proves accurate and the minimum unemployment reading over the prior 12 months was approximately 4.3%, the Sahm Rule would read approximately 0.3 — still below the trigger. However, if February’s -92,000 payroll loss represents the beginning of a genuine deterioration (rather than a one-month anomaly), and unemployment rises toward 4.8-5.0%, the Sahm Rule would trigger for the second time in two years — with far less room to argue it is a false positive in the context of the concurrent oil shock, tariff drag, and fiscal constraint.
What Is the Sahm Rule? The Complete Explanation
The Sahm Rule is a recession indicator developed by economist Claudia Sahm during her tenure at the Federal Reserve Board of Governors. It was first published as part of the Brookings Institution’s Hamilton Project report on fiscal policy stabilization in 2019, in a chapter titled “Direct Stimulus Payments to Individuals.” Sahm’s original purpose was not to create a recession prediction tool but to identify the trigger mechanism for automatic fiscal stimulus — a way to recognize that a recession had begun quickly enough to deploy economic support before the NBER’s official declaration arrived, which historically lags the actual recession onset by 6 to 18 months.
The rule’s mathematical construction is elegant in its simplicity. It measures the difference between two specific values derived from the Bureau of Labor Statistics’ monthly unemployment rate data:
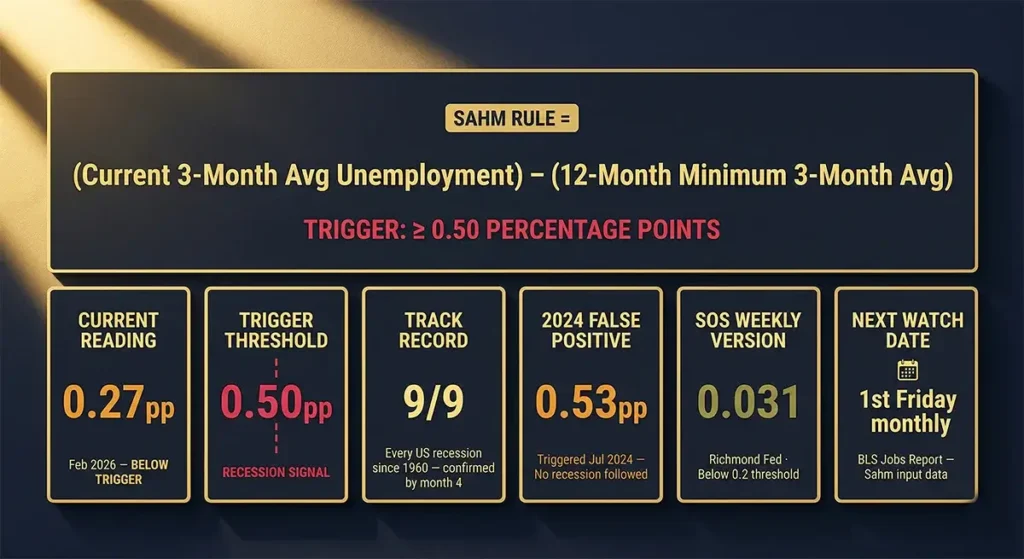
The formula: Sahm Rule reading = (3-month moving average of current unemployment rate) MINUS (minimum of the 3-month moving averages from the preceding 12 months)
When this difference reaches or exceeds 0.50 percentage points, the Sahm Rule is triggered — signaling that the economy is in the early months of a recession. The official FRED series for the Sahm Rule can be tracked in real time at the Federal Reserve Economic Data database (FRED series: SAHMCURRENT), which updates monthly following each BLS jobs report.
To make this concrete with a numerical example: if the 3-month moving average of the unemployment rate is currently 4.8%, and the lowest 3-month moving average over the prior 12 months was 4.2%, the Sahm Rule reading is 0.6 — above the 0.5 trigger, indicating the rule is activated and a recession is underway or imminent.
The genius of the rule is what it is measuring beneath the arithmetic. It is not measuring the absolute level of unemployment — which varies enormously across economic cycles and tells you little about whether conditions are deteriorating. A 5% unemployment rate in a falling environment is far more dangerous than a 5% rate in a stable one. The Sahm Rule measures the rate of change — specifically, whether unemployment has risen rapidly enough from its recent low to match the pattern that has historically characterized the onset of every US recession since the 1950s.
The Historical Record: Performance Across 11 Recessions Since 1950
The Sahm Rule’s reputation rests on a remarkable historical track record. According to the Congressional Research Service’s 2024 analysis for the Library of Congress — one of the most authoritative publicly available assessments of the rule’s performance — the Sahm rule was triggered in every one of the nine recessions since 1960, in all cases by the fourth month of the recession. This “triggered by month four” characteristic is what makes it particularly valuable: it identifies recession onset while the recession is still young, before GDP data confirms it, before the NBER makes its official declaration, and early enough for policymakers and households to begin responding.
The trigger timing across historical recessions tells a consistent story:
| Recession Period | Month Sahm Rule Triggered | Unemployment Rate at Trigger | Sahm Rule Reading at Trigger |
|---|---|---|---|
| Nov 1973 – Mar 1975 | Month 2 (Dec 1973) | 4.9% | 0.50 |
| Jan – Jul 1980 | Month 1 (Jan 1980) | 6.3% | 0.50 |
| Jul 1981 – Nov 1982 | Month 3 (Sep 1981) | 7.6% | 0.50 |
| Jul 1990 – Mar 1991 | Month 2 (Aug 1990) | 5.7% | 0.50 |
| Mar – Nov 2001 | Month 3 (May 2001) | 4.4% | 0.50 |
| Dec 2007 – Jun 2009 | Month 4 (Mar 2008) | 5.1% | 0.50 |
| Feb – Apr 2020 | Month 2 (Mar 2020) | 4.4% | 0.84 (surged to 9.43 at peak) |
| July 2024 (triggered — no recession) | N/A | 4.3% | 0.53 |
The pattern is unmistakable: in every recession since 1950, the Sahm Rule activated within the first four months, providing a reliable early warning that allowed — in theory — swift policy response. The two prior false positives (December 1959 and October 1969) are notable primarily because in both cases, a recession did follow within a few months — meaning the rule was not wrong about the direction of the economy, only slightly premature in its timing.
How the Rule Was Designed to Work: Claudia Sahm’s Original Intention
Understanding the rule’s limitations requires understanding what it was designed to do — which is different from how it is frequently used and discussed. Sahm did not create this indicator as a recession predictor in the strict forecasting sense. She created it as a recession recognizer — a real-time signal that a recession had already begun, designed to trigger automatic fiscal stimulus payments to individuals before a political and legislative response could be organized.
In her 2019 Brookings paper, Sahm proposed that the federal government should automatically begin sending direct payments to individuals the moment the indicator crossed 0.5 — without waiting for congressional authorization, NBER confirmation, or GDP data confirmation. The speed advantage of the Sahm Rule relative to other recession-confirming data was the entire point. GDP data arrives quarterly with a significant lag; NBER declarations arrive on average 12–18 months after a recession begins. The Sahm Rule, built on the BLS monthly unemployment release, could confirm recession onset within 3–4 months of it beginning — fast enough to deploy meaningful economic support during the recession rather than after it had already resolved.
This design origin has important implications for interpretation. The rule was built to minimize false negatives (missing a real recession) rather than false positives (flagging a non-recession). A false negative — failing to trigger stimulus when a recession is underway — causes the most harm in Sahm’s policy framework, because it means people suffer through a recession without receiving automatic support. A false positive — triggering stimulus when no recession is occurring — is suboptimal but relatively harmless if the stimulus payments are modest and temporary. This asymmetric design philosophy means the rule will occasionally activate in ambiguous economic environments that do not develop into full recessions.
The 2024 Trigger: The Case for a Genuine False Positive
In July 2024, the Sahm Rule triggered with a reading of 0.53 — above the 0.5 threshold for the first time since the COVID pandemic shock. The unemployment rate had risen to 4.3%, the highest since October 2021, following a period of softening in the labor market that had been building since the 3.4% low of April 2023. Markets reacted sharply: the Dow Jones fell significantly on the jobs report release day, recession fears spiked, and the Sahm Rule became one of the most-searched economic terms of the year.
The economy did not enter recession. By December 2025, the unemployment rate had moved sideways around 4.2–4.6% without the deteriorating spiral that characterizes genuine recession-linked unemployment dynamics. The US economy continued expanding. And Claudia Sahm herself — in a move that generated significant attention — publicly stated that despite her rule triggering, she did not believe the United States was in recession. In a Bloomberg column, she wrote: “My Recession Rule Was Meant to Be Broken,” arguing that the unusual post-pandemic labor market dynamics — particularly the unprecedented surge in labor force participation as pandemic-era workforce dropouts returned — had created a technical trigger that did not reflect the same underlying economic deterioration that historically accompanied the rule’s activation.
The arguments for treating 2024 as a genuine false positive are substantive. First, the unemployment rise was driven significantly by labor force expansion (more people looking for work) rather than by job losses — a fundamentally different economic dynamic from recession-era unemployment, which is driven primarily by layoffs and demand collapse. Second, GDP remained solidly positive throughout the period — growing at 4.4% in Q3 2025 even as the Sahm Rule hovered near the trigger threshold. Third, real personal consumption expenditures remained positive, consumer spending held up, and none of the NBER’s primary recession indicators — income, employment, consumption, sales, and industrial production assessed together — showed the broad-based decline characteristic of recession.
However, the argument for taking the 2024 trigger seriously also has merit. The rule’s entire value proposition is its consistent historical performance — and explaining away a trigger as a “special circumstances” false positive creates a precedent that can be used to rationalize away future triggers as well. The Sahm Rule’s power lies in its resistance to such interpretive gymnastics: it either triggers or it does not, and it has not triggered outside of recession contexts with sufficient frequency to justify casual dismissal when it does.
The Current 2026 Reading: 0.27 and Rising
As of February 2026 — the most recent data available from FRED — the Sahm Rule reads 0.27 percentage points. This is below the 0.5 trigger threshold, meaning the rule has not activated. However, the context around this number is what makes it consequential in April 2026.
The February reading of 0.27 reflects unemployment that was rising moderately before the Iran war began on February 28, 2026. The unemployment rate had been tracking between 4.3% and 4.5% for much of late 2025 and early 2026, with the 12-month low in the 3-month moving average sitting in the range that produces a 0.20–0.30 Sahm Rule reading. Then, on March 7, 2026, the February payrolls report landed with a shocking -92,000 reading — the first monthly payroll loss outside of a recession since 2020, and sharply below the consensus estimate of +60,000 gains.
Claudia Sahm herself — now chief economist at New Century Advisors — wrote in a Bloomberg opinion piece following the March 2026 jobs report that the strong March data (+178,000 payrolls, unemployment falling to 4.3%) was encouraging but that “the war in Iran threatens to upend” the fragile balance that had kept the labor market stable through 2025. She identified the key risk: the Iran war energy shock could create a negative demand loop in which higher fuel costs reduce consumer spending, which reduces business revenue, which triggers hiring freezes and layoffs that push unemployment higher — potentially fast enough to close the gap between the current 0.27 reading and the 0.50 trigger.
Goldman Sachs projects unemployment rising to 4.6% by Q3 2026 in its current base case — a 0.3 percentage point increase from the current 4.3% reading. If the 12-month low in the 3-month moving average remains near 4.2–4.3%, a Goldman base case scenario would put the Sahm Rule at approximately 0.30–0.35 — still below the 0.50 trigger. But Goldman’s projection is a base case, not a worst case, and is conditioned on the Hormuz situation resolving within approximately six weeks. If oil prices remain elevated through Q2 and Q3 — the scenario that Oxford Economics and other forecasters identify as producing genuine recession — unemployment could rise to 4.8–5.0%, which would produce a Sahm Rule reading of 0.55–0.70 and trigger the indicator for the second time in two years.
Why the Iran War Energy Shock Matters Specifically for the Sahm Rule
The Sahm Rule’s relationship with oil shocks has a specific and important history. Every oil-shock-driven recession since the 1970s — 1973–75, 1980, 1990–91 — was accompanied by a Sahm Rule trigger. The mechanism is direct: oil shocks raise the cost of economic activity for consumers and businesses, reduce discretionary spending, compress corporate margins, trigger hiring freezes and layoffs, and raise unemployment — precisely the sequence the Sahm Rule is designed to detect.
Importantly, researchers studying the Sahm Rule have identified that it performs somewhat differently in supply-shock recessions versus demand-driven recessions. In demand-driven recessions (2001 dot-com, 2008 financial crisis), the Sahm Rule’s activation corresponds closely to the NBER recession declaration because the causal mechanism — weakening demand leading to job losses — is the same mechanism the NBER’s indicators measure. In supply-shock recessions (1973–75, 1980, 1990–91), the Sahm Rule may activate slightly ahead of the NBER declaration because rising unemployment driven by energy-cost-induced layoffs can precede the GDP contraction that formally defines recession.
The 2026 Iran war oil shock has the character of a supply-side shock — oil prices rising because of a disruption to supply rather than because of surging demand. This type of shock has two distinctive economic properties relevant to the Sahm Rule. First, it simultaneously raises inflation (through energy prices) while reducing growth (through demand destruction) — the stagflation combination. Second, it tends to produce rapid unemployment increases in specific energy-sensitive sectors (airlines, trucking, manufacturing, construction) that can move the national unemployment rate upward quickly, potentially triggering the Sahm Rule before the broader economic deterioration has spread to services and the consumer economy. This sector-specific unemployment concentration means the Sahm Rule could activate in 2026 even if the overall economy avoids a formal NBER recession — a scenario analogous to 2024 but driven by a supply shock rather than a participation surge.
The Family of Sahm-Inspired Indicators: Going Beyond the Original
The popularity of the Sahm Rule has spawned a family of related indicators that attempt to improve upon or complement the original in various ways. Understanding these variants helps clarify the original rule’s specific limitations and the different ways economists have tried to address them.
The Real-Time Sahm Rule (SAHMREALTIME): FRED maintains two versions of the Sahm Rule series. The standard SAHMCURRENT uses revised unemployment data; the SAHMREALTIME series uses “real-time” data — the unemployment rates as they were originally reported before BLS annual revisions. The distinction matters because BLS revises unemployment rates each January when the prior year’s December reading is released, which can retroactively change whether the rule was triggered in any given month. The real-time series provides a purer test of how the rule would have performed had it been used as a real-time indicator without the benefit of hindsight from revised data. The real-time series is generally considered the more appropriate benchmark for assessing the rule’s practical utility.
The SOS Recession Indicator (Scavette-O’Trakoun-Sahm-style): Developed by economists John O’Trakoun of the Federal Reserve Bank of Richmond and Adam Scavette of the Federal Reserve Bank of Philadelphia, the SOS indicator applies Sahm’s methodology to the weekly insured unemployment rate (the number of people actively claiming unemployment benefits) rather than the monthly unemployment rate. The advantage is frequency: by using weekly data, the SOS indicator updates 52 times per year rather than 12, providing more real-time recession detection capability. As of the week ending March 28, 2026, the SOS indicator reading was 0.031 — well below its 0.20 recession threshold — suggesting that the insured unemployment rate has not yet risen significantly enough to signal imminent recession onset.
The Michez Rule (Michaillat-Saez): Economists Pascal Michaillat and Emmanuel Saez developed a two-sided variant that the Financial Times named the “Michez rule.” While the original Sahm Rule uses only the unemployment rate, the Michez rule incorporates both the unemployment rate and the job vacancy rate to create a fuller picture of labor market slack. The theoretical advantage is that it captures the balance between labor supply (workers seeking jobs) and labor demand (employers seeking workers) rather than tracking unemployment alone. The Michez rule is typically triggered earlier than the Sahm Rule — detecting recessions on average 1.4 months after they begin rather than 3–4 months — but this earlier sensitivity also makes it somewhat more prone to false positives in normal cyclical fluctuations.
The Morgan Stanley Employment-to-Population Variant: Morgan Stanley economists developed a recession indicator using the same 0.5 percentage point threshold as the Sahm Rule but applying it to the employment-to-population ratio (EPR) rather than the unemployment rate. The EPR measures the fraction of the working-age population that is actually employed — capturing both unemployment and labor force participation changes simultaneously. The Morgan Stanley variant is specifically designed to address the 2024 false positive concern: because rising labor force participation (more people looking for work) drives up measured unemployment without necessarily reflecting demand weakness, an EPR-based indicator would not have triggered in 2024 as the Sahm Rule did, because the employment-to-population ratio remained stable or rose even as unemployment climbed.
The Sahm Rule’s Limitations: What the Creator Herself Acknowledges
Claudia Sahm has been admirably transparent about her indicator’s limitations — a transparency that is itself instructive for understanding how to use it appropriately. Several key limitations deserve explicit discussion.
It detects, it does not predict: The most important limitation is one Sahm has stated explicitly and repeatedly: the rule is a coincident indicator of recession onset, not a leading indicator of recession prediction. When it triggers, it signals that a recession has likely begun within the past 3–4 months — not that a recession is about to begin. This timing distinction matters enormously for practical interpretation. Investors who wait for the Sahm Rule to trigger before adjusting their portfolios or finances are responding after the recession has already started, not before it.
The small sample problem: The Congressional Research Service analysis for Congress is explicit about this: “There is no theoretical reason why the criteria used in the Sahm rule is associated with a recession — it is an observed historical relationship for a small sample and may not always hold going forward.” The rule has been tested across 11 recessions since 1950 — meaningful but limited. Economic structure, labor market institution, and business cycle dynamics change over time in ways that can alter the reliability of any rule derived from historical observation.
Supply shock versus demand shock ambiguity: In stagflationary environments driven by adverse supply shocks — precisely the type of shock the 2026 Iran war represents — the rule activates via rising unemployment but cannot distinguish whether the unemployment is driven by demand weakness (the type that defines a true recession) or supply shock adjustment. As the Grokipedia documentation of the rule notes, this “cannot differentiate these from pure demand recessions, potentially misguiding policy toward demand stimulus over supply-side remedies.” In a stagflation scenario, applying demand stimulus in response to a Sahm Rule trigger could worsen inflation while having limited effect on the supply-driven unemployment.
Post-pandemic structural distortions: The pandemic created unprecedented distortions in labor force participation, immigration flows, gig economy transitions, and sectoral employment composition that may have permanently altered the short-run dynamics of the unemployment rate in ways the pre-2020 historical sample does not capture. The 2024 triggering episode is the most dramatic illustration of this concern, but economists debate whether these structural changes are temporary calibration adjustments or more permanent modifications to the unemployment dynamics the rule was designed to measure.
How to Use the Sahm Rule in 2026: A Practical Framework
Given both the rule’s impressive track record and its documented limitations, what is the appropriate way to incorporate it into your understanding of the current economic environment?
Track the current reading, not just whether it has triggered: The most useful information from the Sahm Rule is not the binary trigger (above or below 0.5) but the trajectory of the reading over time. A reading that was 0.10 six months ago, rose to 0.20 three months ago, and is now at 0.27 — as in the current 2026 situation — tells a clearer story than the single current number. The direction of travel matters as much as the current level. Monitor the FRED SAHMCURRENT series monthly following each BLS jobs report to track the trend.
Contextualize with the full indicator dashboard: No single recession indicator has perfect predictive power in all economic environments. The Sahm Rule is most powerful when it confirms signals from other indicators — the yield curve, the Leading Economic Index, ISM manufacturing, credit delinquency rates — rather than standing alone against a backdrop of positive signals. In April 2026, the Sahm Rule reading of 0.27 is consistent with the broader picture from the US Recession Tracker: multiple indicators are in warning or elevated territory, but none (including the Sahm Rule) has yet crossed into definitive recession territory. This convergent warning signal across multiple indicators is more meaningful than any single indicator’s reading.
Watch the unemployment rate as the critical leading variable: Because the Sahm Rule is a simple function of the unemployment rate, monitoring monthly unemployment data is the most direct way to anticipate where the Sahm Rule is heading. Goldman Sachs’s projection of 4.6% unemployment by Q3 2026 implies a Sahm Rule reading of approximately 0.30–0.35 in the base case. The scenarios that would trigger the rule require unemployment reaching 4.8% or above — watch for this specifically in the April jobs report (released May 2) and the May jobs report (released June 6).
Understand that a trigger does not guarantee recession: The 2024 episode is a legitimate reminder that the Sahm Rule, despite its impressive historical record, is not infallible. If the rule triggers in 2026, it will be a serious and significant signal requiring urgent attention — but not a guarantee that recession is underway. The appropriate response to a trigger is heightened vigilance, defensive financial positioning, and close monitoring of the full economic data picture — not panic-driven decisions based on a single indicator.
For financial planning: act on the direction, not the trigger: The most practically actionable use of the Sahm Rule for individual households and investors is not waiting for the 0.5 trigger but observing the trajectory. A Sahm Rule reading that is rising from 0.10 to 0.20 to 0.27 over consecutive months — as in the current situation — is already telling you that labor market conditions are deteriorating relative to recent lows. That information is actionable for financial resilience planning (building emergency reserves, reducing discretionary debt, reviewing portfolio concentration) well before any formal trigger occurs.
The Sahm Rule in Context: Comparison With Other Real-Time Recession Indicators
The Sahm Rule does not operate in isolation — it is one of several real-time recession indicators that economists and policymakers use simultaneously. Understanding how it relates to its peers helps calibrate appropriate weight.
The OECD’s Composite Leading Indicator (CLI) provides a broader forward-looking signal incorporating manufacturing activity, financial conditions, and survey data across multiple countries. The Conference Board’s Leading Economic Index (LEI) aggregates 10 components including building permits, consumer sentiment, and yield curve slope. Moody’s Analytics’ AI-based recession model — currently reading 49%, just one point from its historically perfect 50% trigger threshold — uses machine learning on 80 years of economic data. The yield curve (10Y-2Y spread) remains at +0.50% in April 2026, technically positive but in the historically dangerous post-uninversion window.
The Sahm Rule’s specific contribution to this indicator ecosystem is its labor market focus. It provides a high-frequency, single-variable signal from the employment data that none of the composite indicators fully replicate. When the Sahm Rule, the LEI, the Moody’s model, and the yield curve post-uninversion warning are all simultaneously flashing caution — as they are in April 2026 — the convergence is more meaningful than any single indicator viewed in isolation.
What Claudia Sahm Is Saying in 2026
Claudia Sahm herself — now chief economist at New Century Advisors and a prominent public economic commentator — has provided the most current and nuanced assessment of her own indicator’s relevance to the 2026 situation. In her April 2026 Bloomberg opinion piece responding to the March jobs report, she characterized the US labor market as maintaining a “curious kind of balance” — the phrase originally coined by Federal Reserve Chair Jerome Powell — while warning that the Iran war threatens to upend that balance through its energy cost transmission to employment.
Her April 2026 assessment is notably more cautious than her July 2024 position when she argued the trigger was likely a false positive. The difference is not that the Sahm Rule reading is higher now — it is actually lower at 0.27 than the 0.53 that triggered in 2024. The difference is the macroeconomic context surrounding the reading. In 2024, the Sahm Rule triggered against a backdrop of strong GDP (4.4% in Q3 2025), rising labor force participation, and a Federal Reserve with clear room to cut rates in response to any slowdown. In 2026, the reading of 0.27 sits against a backdrop of GDP already at stall speed (0.7% in Q4 2025), a Federal Reserve frozen by stagflation, and an oil shock that threatens to accelerate unemployment deterioration faster than any single month of data can capture in real time.
This contextual fragility — the same Sahm Rule reading carrying different risk implications depending on the broader economic environment — is perhaps the most important lesson of the 2024–2026 episode. The Sahm Rule does not exist in isolation. Its signal is strongest when the economic context amplifies its warning and weakest when strong economic fundamentals provide offsetting resilience.
💬 0 Comments