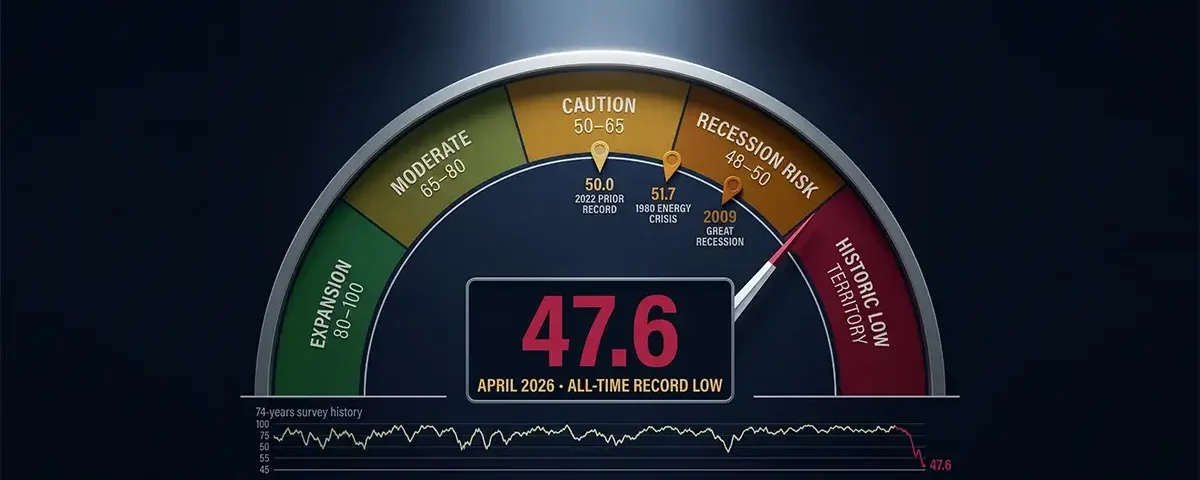
On April 10, 2026, the University of Michigan released a number that stopped economists and market strategists in their tracks. The preliminary April reading of the Consumer Sentiment Index came in at 47.6 — not just a bad month, not just a multi-year low, but the lowest reading in the survey’s 74-year history. Lower than the depths of the Great Recession. Lower than the pandemic shutdown of 2020. Lower than the historic inflation surge of 2022 that peaked at a prior record low of 50. Lower than the 1980 energy crisis reading of 51.7 that defined the darkest moment of the Volcker-era stagflation.
The University of Michigan’s survey director Joanne Hsu provided the verdict without diplomatic softening: “Demographic groups across age, income, and political party all posted setbacks in sentiment, as did every component of the index, reflecting the widespread nature of this month’s fall.” Every component. Every demographic group. Every political affiliation. The sentiment collapse was not concentrated in one sector of the population or one dimension of economic assessment — it was total, simultaneous, and record-breaking across every measurable axis of consumer confidence.
CNN Business captured the historical magnitude precisely: the April 2026 reading of 47.6 is “lower than anything seen in the post World War II era, including during the Great Recession, the pandemic downturn and the historic inflation surge afterward.” Fortune noted the political milestone: “Three of the lowest consumer sentiment readings ever recorded have now occurred within the past nine months of Trump’s second term.” The primary cause is explicit in the survey data itself: Hsu stated that “open-ended comments show that many consumers blame the Iran conflict for unfavorable changes to the economy.”
This cornerstone guide explains everything: what the Michigan Consumer Sentiment Index actually measures and how it is calculated, what the April 2026 record low means across its five components, why consumer sentiment is one of the most consequential leading indicators of GDP growth, the full context of 74 years of history that puts 47.6 in perspective, the inflation expectations component that may concern the Federal Reserve most, why the reading was 98% captured before the April 7 ceasefire, and what the record low means practically for every American household and investor.
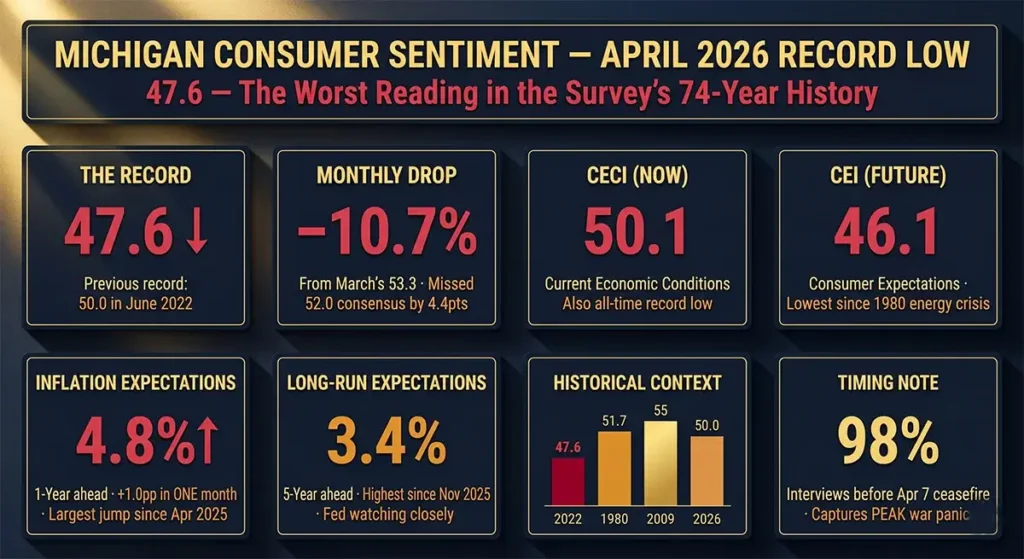
The University of Michigan Consumer Sentiment Index fell to a preliminary record low of 47.6 in April 2026 — the lowest reading in the survey’s 74-year history, below every prior episode including the Great Recession (2008–09), the pandemic (2020), and the post-COVID inflation surge (2022 prior record: 50). The decline was 10.7% from March’s already-depressed 53.3, missed the 52.0 economist consensus by 4.4 points, and was recorded before 98% of respondents knew about the April 7 ceasefire. Year-ahead inflation expectations surged to 4.8% — the largest single-month jump since April 2025 — and long-run 5-year expectations rose to 3.4%, the highest since November 2025, posing a direct challenge to the Federal Reserve’s inflation-anchoring strategy.
What Is the Michigan Consumer Sentiment Index? A Complete Explanation
The University of Michigan Consumer Sentiment Index (MCSI) is one of the oldest, most comprehensive, and most closely watched measures of US household economic confidence in existence. Understanding what it measures, how it is calculated, and what it has historically predicted is essential for reading the April 2026 record low with full analytical depth.
The survey was developed at the University of Michigan’s Survey Research Center beginning in the late 1940s and has been conducted continuously since 1952 — a 74-year data record that provides the historical context for characterizing April 2026’s reading as genuinely unprecedented. Each month, the University of Michigan conducts approximately 500 telephone interviews with a nationally representative sample of US households. Respondents answer five core questions that form the basis of the index:
Question 1 — Personal Finances Currently: “Would you say that you (and your family living there) are better off or worse off financially than you were a year ago?”
Question 2 — Personal Finances Expected: “Now looking ahead, do you think that a year from now you (and your family living there) will be better off financially, or worse off, or just about the same as now?”
Question 3 — Business Conditions 12-Month: “Now turning to business conditions in the country as a whole — do you think that during the next 12 months we’ll have good times financially, or bad times, or what?”
Question 4 — Business Conditions 5-Year: “Looking ahead, which would you say is more likely — that in the country as a whole we’ll have continuous good times during the next 5 years or so, or that we will have periods of widespread unemployment or depression, or what?”
Question 5 — Buying Conditions: “About the big things people buy for their homes — such as furniture, a refrigerator, stove, television, and things like that. Generally speaking, do you think now is a good or bad time for people to buy major household items?”
The five responses are aggregated into the headline index using a formula that calculates each question as the percentage of favorable responses minus the percentage of unfavorable responses, adds 100, then divides the sum of all five adjusted scores by a benchmark value (6.7558) and adds a sample correction constant of 2. The resulting number, benchmarked at 100 for 1966, places the April 2026 reading of 47.6 at 43.3% below the survey’s long-run arithmetic mean of 83.9 — meaning that American consumer confidence is currently less than half its historical average level.
The University of Michigan’s Survey of Consumers data portal publishes the full historical record of all five components and the headline index, updated monthly with preliminary releases on the second Friday of each month and final readings on the fourth Friday.
The Two Sub-Indexes: Current Conditions vs Future Expectations
The headline MCSI is composed of two distinct sub-indexes that capture different dimensions of consumer confidence — and understanding the gap between them in April 2026 provides important analytical depth beyond the headline number.
Current Economic Conditions Index (CECI)
The Current Economic Conditions Index reflects consumers’ views of their current financial situation and the overall state of the economy right now. It is derived from Questions 1 and 5 — current personal finances and current buying conditions for major purchases. In April 2026, the CECI fell to 50.1 — its lowest level on record, representing a 10.2% decline from the previous month and a 16.2% drop from a year earlier.
The CECI reading of 50.1 is particularly striking because it captures what consumers are experiencing today, not what they fear for tomorrow. The fact that current conditions assessment is also at an all-time record low — not merely the expectations component — confirms that the economic distress being registered is felt in the present tense, not merely anticipated. Consumers are not primarily worried about what might happen; they are reporting that what is already happening — $4+ gasoline, accelerating grocery prices, declining asset values — is the worst current economic environment in the survey’s 74-year history.
Consumer Expectations Index (CEI)
The Consumer Expectations Index reflects consumers’ outlook for the future — derived from Questions 2, 3, and 4 covering personal finances expected, 12-month business conditions, and 5-year business conditions. In April 2026, the CEI fell to 46.1 — its lowest level since 1980, when the Volcker-era stagflation and the second oil shock were actively devastating the US economy.
The CEI reading below the CECI — consumers are more pessimistic about the future than about the present — represents a forward-looking dread that compounds the current conditions distress. When consumers expect conditions to worsen from an already-record-low current baseline, the implications for future spending are severe. The spending deferrals and financial conservation behaviors triggered by pessimistic future expectations are the mechanism through which consumer sentiment translates into actual GDP impacts — and April’s double-digit decline in forward expectations is precisely the signal economists use to forecast spending slowdowns 1–3 quarters ahead.
The Five-Component Collapse: No Component Was Spared
The analytical significance of April 2026’s reading is not only its headline level but the unanimous nature of the decline across every component of the index. Joanne Hsu’s statement — “every component of the index” declined — is rare in the survey’s history and represents a breadth of deterioration that distinguishes genuine widespread economic distress from sector-specific or demographic-specific concerns.
1-year business conditions expectations crashed 20% — the largest single-month decline in business outlook in the survey’s recent history. This reflects consumers’ assessment that the US economic environment will be materially worse in twelve months than it is today, driven primarily by the Iran war energy shock, tariff pressures, and the labor market softening captured in February’s shocking −92,000 payrolls reading.
Personal finances assessments fell 11% — households reporting that their own financial situation is deteriorating, citing specifically rising prices (gasoline, groceries, insurance) and shrinking asset values (as equity markets declined year-to-date). This personal finance component is the most direct link between macro economic conditions and household-level budget management, and its 11% decline suggests that the energy shock is genuinely compressing household financial capacity, not merely generating abstract anxiety.
Buying conditions for durables and vehicles deteriorated further — consumers are increasingly reporting that it is a bad time to make major purchases. This component is the most direct leading indicator of near-term durable goods spending and has significant implications for sectors including automotive, appliances, consumer electronics, and home furnishings. When this component deteriorates, actual spending in these categories typically follows within one to three quarters.
Short-term economic outlook plunged 14% from the March reading — following a 20% drop in the month prior, representing a cumulative near-30% collapse in the short-term economic outlook over just two months. This compounding monthly deterioration is the signature of a confidence shock rather than a gradual recalibration — the pace of decline is consistent with how the index has behaved at the onset of prior recessions.
Long-run expectations declined modestly but in the wrong direction — the 5-year business conditions component, which the Federal Reserve monitors most carefully as a signal of whether consumers believe current problems are transitory or structural, declined modestly. The 5-year inflation expectations rising to 3.4% (the highest since November 2025) represents a particular concern for the Fed: if consumers begin embedding higher inflation into their long-run expectations, the wage-price spiral mechanism that characterized the 1970s stagflation becomes more plausible.
The Inflation Expectations Bombshell: 4.8% in One Year
Within an already alarming headline report, the inflation expectations components deserve separate analytical attention because they directly affect Federal Reserve policy and represent a potentially self-fulfilling element of the current economic picture.
Year-ahead inflation expectations surged to 4.8% in April 2026 — up from 3.8% in March. This 100-basis-point single-month jump is the largest one-month increase in inflation expectations since April 2025 (when Trump’s “Liberation Day” tariff announcement had produced a similar spike). The April 2026 reading now exceeds every 2024 reading and sits well above the 2.3–3.0% range that prevailed in the two years before the pandemic disruptions. The current year-ahead reading compares with the peak of tariff-driven expectations in April 2025 when the survey briefly reached 6.5% — suggesting that the Iran war energy shock has produced expectations that, while severe, have not yet matched the full peak of tariff anxiety from a year earlier.
Long-run 5-year inflation expectations rose to 3.4% — up 0.2 percentage points from March and the highest since November 2025. This longer-run component is the one that Federal Reserve economists monitor with particular attention, because it captures whether consumers believe current inflationary episodes will be transitory (inflation expectations stay anchored near 2%) or structural (inflation expectations move meaningfully above 2% and stay there). The Fed’s entire credibility as an inflation-fighting institution rests on maintaining anchored long-run inflation expectations — the mechanism through which Fed communication prevents today’s energy shock from becoming tomorrow’s entrenched wage-price spiral.
The Benzinga analysis captured the Fed’s specific dilemma with clarity: “Core CPI came in at a contained 0.2% month-over-month in March, offering some technical relief and indicating that the Iran war is mostly an energy-driven inflation, for now. But the Michigan data show consumers are not anchoring on the soft-core number. They are anchoring on the $4.15 gallon of gasoline and the 4.8% inflation they expect to be paying over the next twelve months. When what consumers experience and what they expect diverges this sharply from the measure the Fed officially monitors, the central bank’s communication task becomes significantly harder.”
This divergence — between the Fed’s core inflation focus and consumers’ headline energy-price experience — is the structural challenge that makes the current episode more similar to the 1970s oil shock environment than to the 2022 post-COVID inflation episode. In 2022, energy prices were rising but consumers had strong employment, rising wages, and residual pandemic savings to buffer the impact. In 2026, consumers face the same energy price shock on top of already-depleted savings, elevated debt service costs, a hiring-frozen labor market, and Q4 GDP growth of just 0.5% as the economic foundation.
74 Years of History: Why 47.6 Is Genuinely Unprecedented
The claim that 47.6 is the lowest reading in the survey’s history is not rhetorical — it is a specific, documentable claim that requires the full historical context to appreciate. The Advisor Perspectives analysis noted that the current level of 47.6 is 43.3% below the survey’s average reading of 83.9 — meaning the April 2026 reading is less than 57% of the historical average. No prior month in 74 years of continuous data has produced a reading this far below the historical mean.
The historical comparison points that are most instructive:
| Episode | MCSI Low Reading | Primary Driver | Pre-Recession? |
|---|---|---|---|
| 1974 Arab oil embargo recession | ~57–60 | First oil shock; Watergate; Nixon resignation | Yes — recession Dec 1973 |
| 1980 Iran Revolution oil shock | ~51.7 | Second oil shock; 20% interest rates | Yes — recession Jan 1980 |
| 1990 Gulf War recession | ~60–64 | Gulf War oil shock; S&L crisis | Yes — recession Jul 1990 |
| 2008–09 Great Recession | ~55–57 | Financial crisis; housing collapse; bank failures | Yes — recession Dec 2007 |
| 2022 Post-COVID inflation peak | 50.0 | 9.1% CPI; $5+ gasoline; rate hike uncertainty | No — soft landing |
| April 2026 | 47.6 | Iran war; Hormuz closure; $4+ gas; 4.8% 1-yr inflation expectations | TBD — risk elevated |
The Advisor Perspectives analysis adds the most analytically important historical observation: “The current level of 47.6 is below the index’s value at the start of all six recessions since its inception.” This means that if the historical relationship between this sentiment level and recession onset holds in 2026, the US economy is already in the zone that has — in every prior episode — been followed by an officially declared recession within several months. The 2022 episode at 50 is the only time a reading near this level did NOT precede a recession — and that episode had a specific non-recessionary resolution (rapid energy price normalization, labor market strength, and pandemic savings buffers) that the 2026 episode does not currently have in the same magnitude.
Bipartisan Sentiment Collapse: The Political Significance of Universal Pessimism
One of the most politically and analytically significant features of the April 2026 sentiment reading is its bipartisan nature. Axios reported that “since February, before the war, sentiment has fallen 10 points among both Democrats (to 31.8) and Republicans (to 87.1).” This parallel decline — identical in magnitude if not in absolute level — reflects the specific economic mechanism of the Iran war energy shock: gasoline at $4+ per gallon imposes the same dollar cost on a Republican driver in Texas and a Democratic driver in California. Energy prices are agnostic to political affiliation.
This bipartisan aspect is analytically meaningful beyond the political commentary it generates. Sentiment readings that are driven by partisan perception of the president’s economic management tend to reverse when the political situation changes without necessarily tracking underlying economic reality. Sentiment readings that reflect genuine cross-partisan economic pain — based on prices that every household regardless of political affiliation is paying at the pump and the grocery store — are more durable in their economic consequences. They are more likely to produce actual behavior changes (spending deferrals, saving increases, purchase postponements) rather than just survey responses.
The April 2026 reading exhibits the characteristics of genuine behavioral-consequential sentiment rather than partisan-perception-driven sentiment: it is grounded in specific, measurable, universal price experiences (gasoline, food, energy) that directly affect every household’s budget regardless of how they vote. This makes the sentiment reading more predictive of actual consumer spending changes — and therefore more consequential for the GDP outlook — than partisan-driven sentiment swings.
Consumer Sentiment as GDP Leading Indicator: The Spending Transmission Mechanism
The reason the record-low Michigan Consumer Sentiment reading matters beyond the emotional narrative is its historical relationship with GDP growth — specifically, its role as a leading indicator of consumer spending, which accounts for approximately 70% of US GDP.
The Advisor Perspectives analysis documented the historical relationship directly: “Historically, prolonged periods where the moving average remains at these depressed levels have closely correlated with negative GDP growth.” This is not a coincidence — it is a causal mechanism with well-documented behavioral economics foundations. When consumers are pessimistic about their financial situation and economic future, they change their behavior in specific, measurable ways:
Deferral of major discretionary purchases: The buying conditions component’s deterioration directly foreshadows reduced spending on automobiles, appliances, electronics, and home furnishings. These categories represent significant portions of retail sales and manufacturing output, and their decline flows through supply chains to affect production, employment, and GDP.
Increased saving and debt reduction: Households facing price stress and economic uncertainty typically increase their savings rate and reduce new debt acquisition. This behavioral shift reduces consumption spending directly, compounding the discretionary spending deferral effect.
Reduced spending on restaurants, entertainment, and travel: Discretionary services spending — dining out, entertainment, leisure travel — is the first category that households cut when financial confidence deteriorates. The airline industry’s fuel cost crisis (described in warflation analysis) compounds this: not only are consumers less confident, the cost of travel has risen sharply, making the sector doubly vulnerable.
Self-fulfilling expectations: Perhaps most importantly, when consumers widely expect economic conditions to deteriorate, their collective behavior changes in ways that actually produce the deterioration they expect. If millions of households simultaneously reduce spending in anticipation of economic hardship, business revenues decline, hiring slows, and the recession anticipated by consumers materializes — not because the underlying economic fundamentals required it, but because the expectation itself became the cause.
Goldman Sachs research found that AI’s net negative payroll effect of 16,000 jobs per month was already compressing hiring momentum before the war. Layered on top of this structural labor market softness, an energy shock, and a Q4 GDP base of only 0.5%, consumer sentiment at its lowest level in 74 years represents a demand-side headwind of historical proportions arriving at exactly the wrong moment.
The 98% Pre-Ceasefire Problem: What the Full April Reading Will Show
The preliminary April reading of 47.6 was collected when 98% of survey interviews had been completed before the April 7 ceasefire announcement between the US and Iran. This timing detail is analytically important in two contradictory ways.
On one hand, it suggests that the reading captures the peak panic of the Iran war energy shock — the moment of maximum uncertainty before diplomatic resolution. If the ceasefire holds, Hormuz reopens fully, and gasoline prices normalize toward $3.50 or lower over the coming weeks, the final April reading (released on the fourth Friday of April) and the May reading could show meaningful rebound as the primary trigger for the record low is partially reversed. The report itself acknowledged this: “Economic expectations will likely improve after consumers gain confidence that the supply disruptions stemming from the Iran conflict have ended and gas prices have moderated.”
On the other hand — and this is the analytically more important consideration — the ceasefire’s economic consequences are not reversed by a ceasefire announcement. As analyzed in the Hormuz and warflation coverage, gasoline prices fall more slowly than they rise (the “rockets and feathers” principle). The 40%+ energy price increase that drove the inflation expectations surge to 4.8% will not fully unwind for months even under an optimistic ceasefire scenario. The structural damage to long-run inflation expectations — which rose to 3.4% and represent the Fed’s most consequential concern — does not reverse with a diplomatic announcement. And the GDP damage from Q1 2026’s energy shock sub-period cannot be erased by the ceasefire: whatever happened to consumer spending in March, as captured in the Q1 GDP data releasing April 30, already happened.
The practical implication: the final April reading and the May reading will likely show partial recovery from 47.6 — perhaps returning to the 50–55 range if the ceasefire holds and gasoline prices normalize. But a return to the pre-war sentiment range of 56–64 would require sustained Hormuz reopening, meaningful gasoline price normalization, and the resolution of the secondary inflationary pressures (food, transportation, services) that have been building since the war began. None of these conditions are fully in place as of the April 14 writing date.
Michigan Consumer Sentiment vs Conference Board Consumer Confidence: Key Differences
The Michigan Consumer Sentiment Index is frequently mentioned alongside the Conference Board Consumer Confidence Index as the two primary measures of US consumer psychology. Understanding their differences is essential for interpreting the April 2026 data correctly.
The Advisor Perspectives analysis summarized the key distinction: “The Consumer Confidence Index is more influenced by employment and labor market conditions while the Michigan Sentiment Index is more focused on household finances and the impact of inflation.” This distinction is critically important for April 2026 analysis. The Michigan index’s record low is driven primarily by the energy price shock and inflation expectations — the household-finance channel. The Conference Board index, because it weights labor market conditions more heavily, has shown less dramatic deterioration because employment — while weakening — has not yet collapsed in the way that would drive the Conference Board measure to equivalent record lows.
The divergence between the two measures in the current environment actually provides additional analytical information: the severity of the Michigan reading relative to the Conference Board reading confirms that the primary driver of consumer distress is the inflation and energy cost channel rather than the employment channel. This distinction matters for policy: supply-side energy price inflation (which is what the Iran war has produced) is relatively resistant to Federal Reserve rate policy, while demand-side employment collapse (which would drive the Conference Board measure lower) is directly addressable through monetary easing. The current environment — where Michigan is at a record low but Conference Board is less extreme — is consistent with a supply-side shock environment rather than a demand-collapse environment, reinforcing the stagflation-risk framing that characterizes 2026’s economic situation.
What the Record Low Means for the Federal Reserve’s April 28–29 Decision
The Federal Reserve’s April 28–29 FOMC meeting arrives with two contradictory data points from the April 10 releases: the March CPI at 3.3% (headline inflation rising, driven by energy) and the Michigan Consumer Sentiment at a record-low 47.6 (household confidence collapsing, driven by energy). Both data points point to the same cause — the Iran war energy shock — but in different analytical directions for monetary policy.
The 3.3% CPI and 4.8% one-year inflation expectations argue for rate hikes or at minimum extended holds — the traditional monetary policy response to rising inflation. The 47.6 Consumer Sentiment and the demand-destruction implications of the worst consumer confidence reading in 74 years argue for rate cuts — the traditional monetary policy response to collapsing household confidence and recession risk. The March FOMC meeting minutes already showed the Fed divided over whether the next move should be a hike or a cut — and the April 10 dual release of record-high energy inflation expectations and record-low consumer confidence has not resolved that division, it has deepened it.
Fed Chair Jerome Powell’s specific challenge is that the Michigan survey’s inflation expectations surge to 4.8% (1-year) and 3.4% (5-year) directly threatens the “well-anchored expectations” narrative that he has used to justify not aggressively tightening in response to the energy shock. If consumers consistently report expecting 4.8% inflation a year from now, wage negotiation behavior begins to reflect those expectations — workers demand 5%+ raises to stay ahead of expected prices — and the supply-side inflation shock begins generating second-round demand-side inflation that the Fed cannot attribute to temporary energy dynamics. The record-low sentiment reading complicates this already-fraught situation by confirming that the energy shock is not merely generating price pressures but is actively destroying the consumer confidence that supports the spending growth the Fed needs to preserve to avoid recession.
Practical Implications for Households: What the Record Low Means for Your Financial Decisions
For American households navigating the most pessimistic consumer environment in 74 years, the record-low Michigan reading is not merely statistical background — it is a practical signal that validates and calibrates specific financial actions.
Validate your pessimism without being paralyzed by it: The record-low sentiment reading confirms that the financial anxiety most American households are feeling is not an individual failure of perspective — it is the accurate, rational response to genuinely difficult economic conditions. Energy prices are up 40% since February. CPI is at 3.3% and rising. GDP grew at only 0.5% in Q4 2025. Recession probability estimates from major institutions range from 30% to 49%. The economic environment objectively warrants caution and financial conservatism. This is not pessimism bias; it is accurate assessment.
Defer non-essential major purchases: The buying conditions component’s deterioration — which historically precedes actual spending slowdowns — is your personal financial signal as well as a macro indicator. If you have been planning a new vehicle purchase, major appliance replacement, or home renovation that can be deferred without real consequence, the current environment argues for delay. Major purchases made at today’s elevated financing rates and consumer goods prices (still elevated from tariff and energy cost pass-throughs) will likely be available at similar quality and better terms if conditions normalize over the next 6–12 months.
Build cash reserves before inflation erodes them: The 4.8% one-year inflation expectation is itself a financial planning input. Households with large cash positions in low-yield savings accounts face 4.8% real erosion per year if those expectations prove accurate — which argues for moving savings into higher-yield instruments (money market funds, short-duration TIPS, I-bonds) that provide some inflation protection. However, this inflation-protection consideration is secondary to the first priority of ensuring adequate emergency liquidity: 6 months of essential expenses in readily accessible form, regardless of yield optimization.
Monitor the final April reading and the May reading: The preliminary 47.6 reading will be updated with the final April figure (released the fourth Friday of April) and the first May reading (released the second Friday of May). If the ceasefire holds, gasoline prices meaningfully decline, and the final April reading shows recovery toward 52–55, that signals the worst of the sentiment shock may be passing. If the final April reading confirms or deepens 47.6, or if the May reading shows continued deterioration, the economic consequences described above (spending deferrals, GDP drag, Fed dilemma) will intensify.

💬 0 Comments