The Federal Reserve’s interest rate decisions affect virtually every financial product you use — your mortgage rate, your savings account yield, your car loan rate, your credit card APR, and your investment portfolio. Yet most Americans have only a vague understanding of how Federal Reserve meetings work, what the FOMC actually decides, and how to interpret the signals the Fed sends about future policy. This guide demystifies the entire process.
The Federal Reserve’s Federal Open Market Committee (FOMC) meets 8 times per year and sets the federal funds rate — the most important single interest rate in the US economy. Every rate change ripples through every financial product within days to months. Understanding how to read Fed signals lets you make better-timed decisions about mortgages, savings accounts, bonds, and debt.
What Is the Federal Reserve and What Does It Do?
The Federal Reserve — established by Congress in 1913 — is the central bank of the United States. It does not accept consumer deposits or make personal loans. Instead, it operates the financial infrastructure enabling the entire banking system, sets monetary policy, supervises financial institutions, and acts as lender of last resort during financial crises.
The Fed’s Congressional mandate — the “dual mandate” — directs it to pursue two objectives simultaneously: maximum employment (lowest sustainable unemployment rate) and stable prices (inflation at approximately 2% annually). These goals sometimes align and sometimes conflict — creating the policy tensions that dominate financial news in 2026.
The FOMC: Who Makes the Rate Decision
The Federal Open Market Committee is the 12-member body that sets monetary policy. Its voting members are: the 7 members of the Board of Governors (appointed by the President, confirmed by the Senate), the President of the Federal Reserve Bank of New York (permanent voting member), and 4 of the 11 remaining Reserve Bank Presidents (rotating on 1-year terms). The FOMC meets 8 times per year — approximately every 6 weeks. Meeting dates are published a year in advance.
How Rate Changes Flow Through Your Finances
| Financial Product | How Quickly It Responds | Direction |
|---|---|---|
| Prime Rate | Immediately | Moves exactly with federal funds rate |
| HELOC interest rates | Within 1–2 billing cycles | Variable — tracks Prime Rate directly |
| Credit card APR | Within 1–2 billing cycles | Variable cards move with Prime Rate |
| HYSA and money market rates | Days to 2 weeks | Online banks adjust quickly; big banks slowly |
| CD rates | Days to weeks | Banks pre-emptively lower before a rate cut |
| Auto loan rates | Weeks to months | Influenced by, not tied directly to, fed funds rate |
| 30-year mortgage rates | Days to weeks (indirect) | Tied to 10-year Treasury yield, not fed funds rate directly |
| Bond prices | Immediately | Inverse — rates fall → bond prices rise |
| Stock market | Immediately upon announcement | Complex; rate cuts generally positive, hikes generally negative |
How to Read an FOMC Policy Statement
The FOMC statement released after each meeting is carefully worded — every word is deliberate and has been debated by 12 economists. Key phrases to watch:
“The Committee decided to lower/raise/maintain the target range…” — The actual rate decision, always in the first paragraph.
Language about economic conditions: Compare adjectives to prior statements. “Solid” weakening to “moderate” weakening to “slowing” is a progression signaling deteriorating conditions — often a precursor to rate cuts.
Inflation characterization: Track how the statement describes inflation relative to the 2% target. “Remains elevated” versus “has eased but remains above” versus “has returned near” represents meaningful shifts in the Fed’s assessment of inflation progress.
“Data-dependent”: When the Fed describes future decisions as data-dependent, it means the next move is not predetermined — it depends on upcoming economic reports. This produces significant market volatility around subsequent data releases (jobs reports, CPI, GDP).
The dot plot (published quarterly): Each FOMC member submits an anonymous projection for where they expect the federal funds rate to be at the end of each of the next 3 years. These projections — visualized as dots on a chart — are the clearest available signal of where the Fed expects rates to go. Markets move significantly in response to shifts in the dot plot distribution.

The 2026 Fed Policy Dilemma
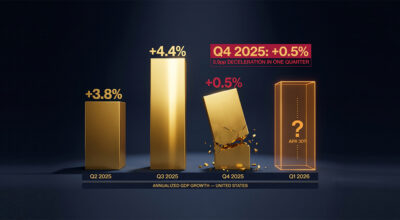
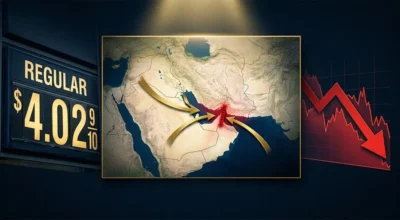
In a standard recessionary environment, the Fed’s playbook is clear: cut rates aggressively to stimulate borrowing and spending. In 2026, the Fed faces an unusual constraint: tariff-driven inflation has kept price pressures elevated even as economic growth slows. Cutting rates aggressively risks reigniting inflation. Keeping rates elevated risks tipping a slowing economy into recession.
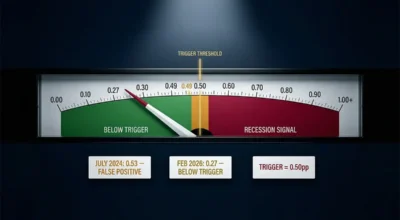
This is the classic stagflation trap that constrained the Fed in the 1970s. Market participants are closely watching each FOMC statement for evidence of which risk the Fed considers dominant. A shift in language suggesting the Fed prioritizes recession prevention over inflation control would signal more aggressive rate cuts ahead — with significant implications for mortgage rates, bond prices, savings yields, and stock valuations.
How to Use Fed Signals in Your Personal Finances
When the Fed signals rate cuts ahead: Lock in longer-term CDs and fixed-rate bonds before rates fall. Consider refinancing any variable-rate debt (HELOC, ARM) to fixed rate while you can. Expect your HYSA rate to decline within weeks of the first cut.
When the Fed is actively cutting rates: Monitor mortgage rates for refinancing windows — the best opportunities often appear 3–6 months into a cutting cycle. Bond ETF prices will rise as existing bond holdings appreciate in a falling-rate environment.
Where to track Fed decisions: Bookmark federalreserve.gov/monetarypolicy/fomccalendars.htm for meeting dates and statement archives, and the CME FedWatch Tool for market-implied probability of rate changes at each upcoming meeting.
💬 0 Comments