
The Federal Poverty Level (FPL) is one of the most consequential numbers in American public policy — it determines eligibility for dozens of federal assistance programs that collectively serve over 100 million Americans, yet most people have no idea what the current thresholds are, how they are calculated, or what benefits they might qualify for based on their household income relative to these thresholds. In 2026, with recession risk elevated and household incomes under pressure, understanding the federal poverty guidelines is genuinely valuable financial knowledge.
The 2026 Federal Poverty Level for a family of four is $32,150/year. Most federal assistance programs use a percentage of this threshold — typically 100%, 130%, 138%, 150%, or 400% of FPL — to determine eligibility. A household earning $55,000/year with four people sits at approximately 171% of FPL — too high for Medicaid in most states but eligible for significant ACA marketplace premium tax credits. Understanding where your household falls relative to these thresholds tells you exactly which programs you may qualify for.
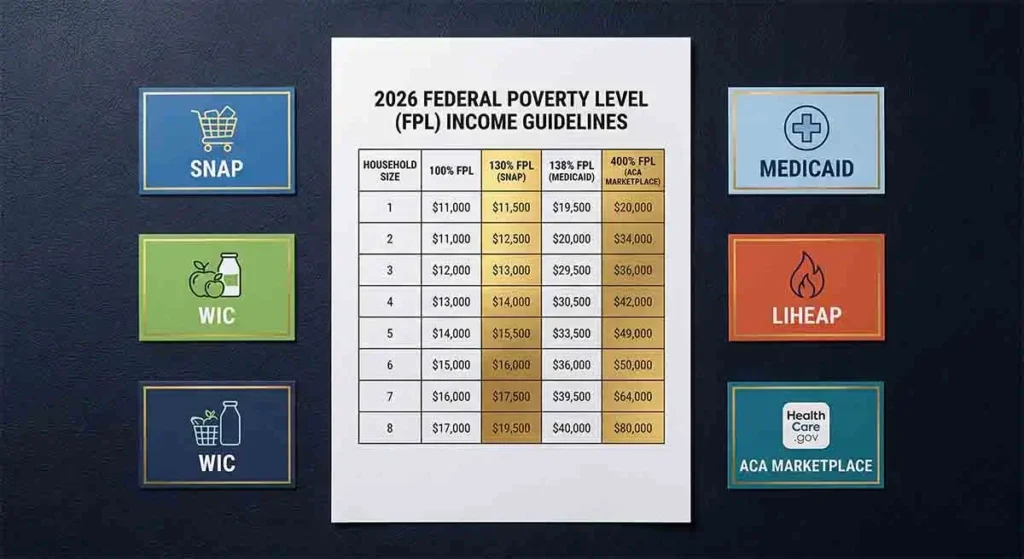
The 2026 Federal Poverty Guidelines: Complete Reference Table
| Household Size | 100% FPL | 130% FPL (SNAP) | 138% FPL (Medicaid) | 200% FPL | 400% FPL (ACA cap) |
|---|---|---|---|---|---|
| 1 person | $15,060 | $19,578 | $20,783 | $30,120 | $60,240 |
| 2 people | $20,440 | $26,572 | $28,207 | $40,880 | $81,760 |
| 3 people | $25,820 | $33,566 | $35,632 | $51,640 | $103,280 |
| 4 people | $31,200 | $40,560 | $43,056 | $62,400 | $124,800 |
| 5 people | $36,580 | $47,554 | $50,480 | $73,160 | $146,320 |
| 6 people | $41,960 | $54,548 | $57,905 | $83,920 | $167,840 |
| Each additional person | +$5,380 | +$6,994 | +$7,424 | +$10,760 | +$21,520 |
Note: Alaska and Hawaii have higher FPL thresholds. These are the 48 contiguous states and DC guidelines for 2026. Actual eligibility for specific programs depends on each program’s rules and your state’s administration of federally funded programs.
How the Federal Poverty Level Is Calculated
The federal poverty guidelines were originally developed in 1963 by Social Security Administration economist Mollie Orshansky, based on research showing that families typically spent one-third of their income on food. She multiplied the Agriculture Department’s minimum food budget by three to arrive at a poverty threshold. The resulting figure has been updated annually since then by the Consumer Price Index — but it retains the fundamental structure of the original 1963 calculation, meaning it does not fully account for modern expenditure patterns (healthcare, childcare, and housing now consume far more than food as a share of household budgets), geographic cost-of-living differences, or tax and benefit impacts on actual household resources.
The FPL is widely considered an imperfect but administratively useful benchmark for program eligibility — not an accurate representation of what it actually costs to meet basic needs in the United States. The Supplemental Poverty Measure (SPM), developed by the Census Bureau in 2011, provides a more accurate picture of poverty by accounting for government benefits received, taxes paid, and work-related expenses — but the SPM is a research tool, not an administrative eligibility threshold.
Major Federal Programs and Their FPL Eligibility Thresholds
| Program | Income Threshold | Notes |
|---|---|---|
| Medicaid (ACA expansion states) | 138% FPL | 41 states + DC have expanded; remaining states have lower or more restricted thresholds |
| CHIP (Children’s Health Insurance) | 200–300% FPL | Varies by state; most states cover children to at least 200% FPL |
| SNAP (food assistance) | 130% FPL gross / 100% FPL net | Net income after deductions; most states also have categorical eligibility expanding access |
| ACA Premium Tax Credits | 100–400% FPL (no cap since 2021) | ARP extension removed upper cap — credits available above 400% FPL if plan cost exceeds 8.5% of income |
| LIHEAP (energy assistance) | 150% FPL or 60% state median income | States have flexibility; whichever threshold is higher |
| WIC (Women, Infants, Children) | 185% FPL | For pregnant/postpartum women, infants, and children under 5 |
| Head Start | 100% FPL (priority) / 130% FPL (enrollment) | Up to 35% of enrollment may be above 100% FPL |
| School Lunch (free) | 130% FPL | Reduced price: 130–185% FPL |
| Section 8 / Housing Choice Voucher | 50% Area Median Income | Uses AMI rather than FPL — varies significantly by local market |
| Federal Pell Grant (college) | Primarily below 150% FPL for maximum award | FAFSA-based; partial awards extend higher |
| EITC (Earned Income Tax Credit) | Approximately $57,000–$67,000 max (varies by children) | Income phase-out ranges, not directly FPL-based |
ACA Health Insurance and the FPL: The Most Impactful Connection
For millions of American households — particularly those who are self-employed, between jobs, or employed by small businesses without group health insurance — the ACA marketplace’s premium tax credit structure is the most financially significant consequence of household income relative to the FPL. Understanding exactly how the subsidy calculation works can save thousands of dollars annually.
Premium tax credits on the ACA marketplace are calculated so that households pay no more than a specified percentage of income for the benchmark Silver plan (the second-lowest-cost Silver plan in your area). In 2026:
- 100–133% FPL: Pay 0–2% of income for the benchmark plan
- 133–150% FPL: Pay 2–4% of income
- 150–200% FPL: Pay 4–6% of income
- 200–250% FPL: Pay 6–8% of income
- 250–400% FPL: Pay up to 8.5% of income
- Above 400% FPL: Pay no more than 8.5% of income (American Rescue Plan extension, renewed through 2025)
The practical implication: a family of four with income of $62,400 (200% FPL) pays no more than approximately $3,120–$3,744/year (5–6% of income) for the benchmark Silver plan — regardless of the plan’s actual premium. The government covers the remainder through the tax credit. A family of four with income of $90,000 (288% FPL) pays no more than approximately $7,650/year (8.5% of income). Use the subsidy estimator at healthcare.gov/lower-costs/ to calculate your specific credit before any marketplace enrollment decision.
Income Management Strategies Near FPL Thresholds
For households near key eligibility thresholds, income management strategies can maintain or improve access to benefits without reducing actual financial wellbeing:
Pre-tax contributions as income management: Contributions to traditional 401(k), traditional IRA, and HSA accounts reduce your Adjusted Gross Income (AGI) — which is the income figure used to determine eligibility for most federal programs. A household at 145% FPL that contributes $4,300 to an HSA may move below the 138% FPL Medicaid threshold in their state, qualifying for Medicaid coverage rather than subsidized marketplace coverage. The strategic implications of pre-tax contributions on program eligibility are worth analyzing carefully with a tax professional.
The Medicaid cliff in non-expansion states: In the 9 states that have not expanded Medicaid, households with income between 100% and 138% FPL are in a “coverage gap” — too high for Medicaid but too low for premium tax credits (which begin at 100% FPL). If you live in one of these states (Texas, Florida, Georgia, Mississippi, Alabama, South Carolina, Tennessee, Kansas, or Wisconsin), verify your state’s specific Medicaid thresholds through your state’s Medicaid agency before assuming you are in the coverage gap — some of these states have specific Medicaid categories that may cover you.
How to Find All Programs You Qualify For
Benefits.gov remains the single most comprehensive tool for identifying federal benefits eligibility — completing the online questionnaire (which takes approximately 10–15 minutes) generates a customized list of all federal programs you may qualify for. For state and local programs not captured by Benefits.gov, call 211 to reach a local United Way social services specialist who can identify additional resources in your community. Many households that believe they earn “too much” for assistance are surprised to discover programs they qualify for — particularly for healthcare coverage, food assistance, childcare subsidies, and education grants.


💬 0 Comments